[ad_1]
Click here to view above full size…
Chances are you have already heard about the S&P 500 gaining more than 5% in October and November this year. We can confirm this feat is not all that common occurring only 11 times since 1950 including this year. The longest S&P 500 streak of monthly gains in excess of 5% per month was in 1998 beginning in September with a 6.2% advance, followed by 8.0% in October, 5.9% in November and 5.6% in December for a total gain of 28.4% in four months. The most recent streak was respectable, up 13.79% in two months.
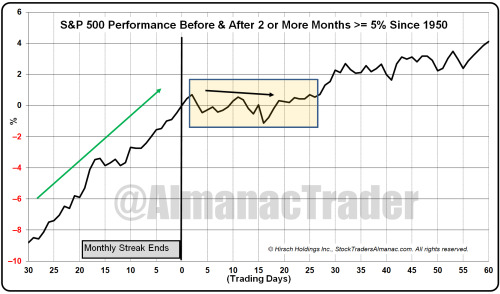
Based upon the Bull & Bear Markets table on page 134 of the 2023 Stock Trader’s Almanac, all ten previous streaks occurred in bull markets. Streaks in 2020, 2009, 2002, 1998 and 1974 all occurred early in new bull markets. Performance after the previous 10 monthly streaks ended was broadly bullish, but choppy during the 1-month immediately following. The recent tough start of trading this month is consistent with the consolidation that followed past streaks and the more recent 21-year Seasonal Pattern for December.
Digging deeper into the data we have graphed the 30 trading days before and 60 trading days after the previous 10 streaks in the following chart. A typical calendar month has 21 trading days on average. We elected to set our reference point at the day the monthly streak ended. The sizable gain in the 30 trading days before is clear. What also becomes more visible is the tendency for the S&P 500 to pause and consolidate those gains in the 15-20 trading days after the streak’s end. Following this period, the S&P 500 historically resumed its march higher and was always higher 1-year after the streak ended.

[ad_2]
Image and article originally from jeffhirsch.tumblr.com. Read the original article here.

