The parade of commentators continues week in and week out to talk about the recession in 2023. It is important to consider whether, in late 2021, any of them saw a recession or a stock market decline in 2022.
Then there was the inversion by the bond market in March/April, and everyone said don’t worry as the recession won’t be here for at least a year. Even if that may have been true, the market won’t wait for it to show up in the data after the fact. If you see two negative quarters of GDP, we are already in one. The market looks forward.
So now the brilliance is showing through to call a continuation of the downtrend. I don’t really care when the recession ends. I guess I do, but what I really care about is when the stock market suggests it is not going to get worse and starts rising based on things getting better in the future.
Will these economists have a method of finding a bottom close to the stock market bottom? Will they wait until the 200-day moving average is tilted up and price has been above it for three months, and they’ll still be looking for the economic data to start improving? A nice 3-6 month lag or something? What is the signal?
We can all discuss the different methods for finding a bottom and how accurate they were. One whipsaw signal one time doesn’t invalidate a system. You still need stops when investing if you want your winners to outrun the losers. But it certainly helps to realize when the downside risk is less than the upside return and to be ready to ride a trend higher.
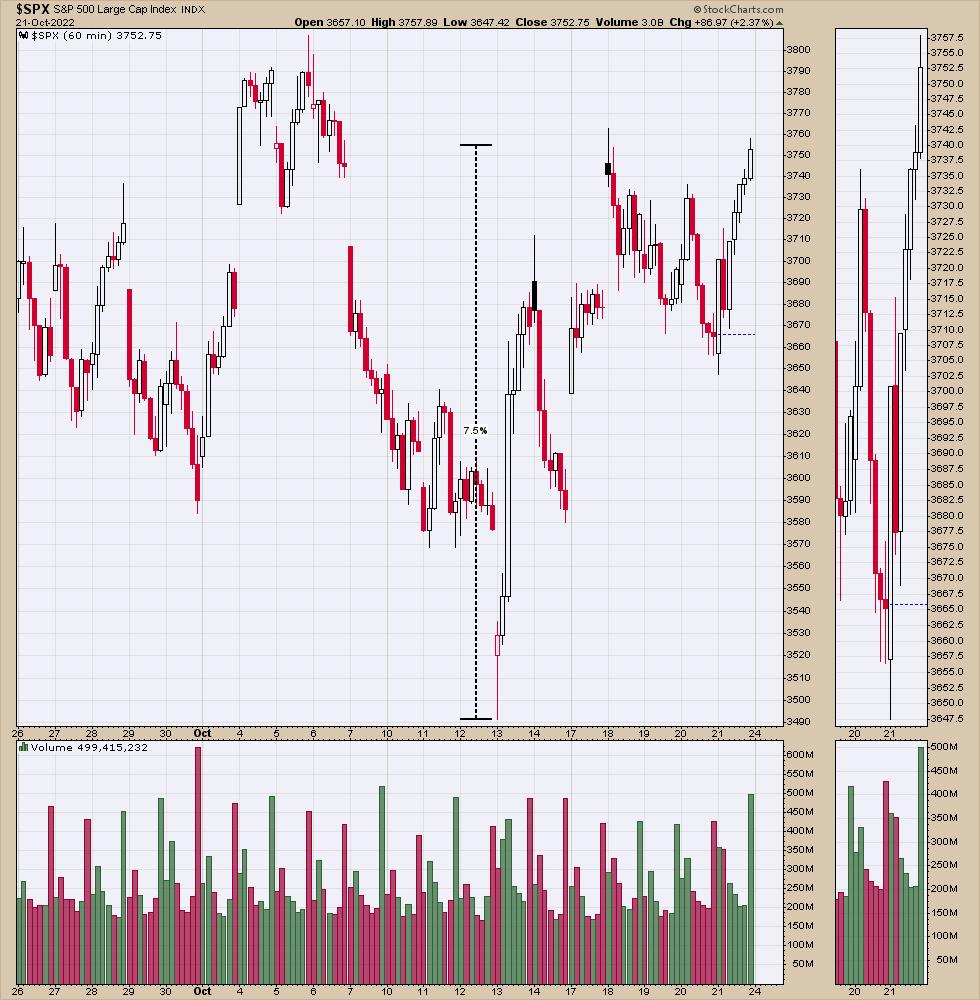
All that to say, my internal data has been turning more bullish for weeks, getting us ready for this low. The Friday, October 21st strong close turned a lot of other systems onto a buy signal. Interestingly, we are already 7.5% off the lows. Nice bounce so far. The $SPX Index was down 28% at the lows of last Thursday, if my math is correct.
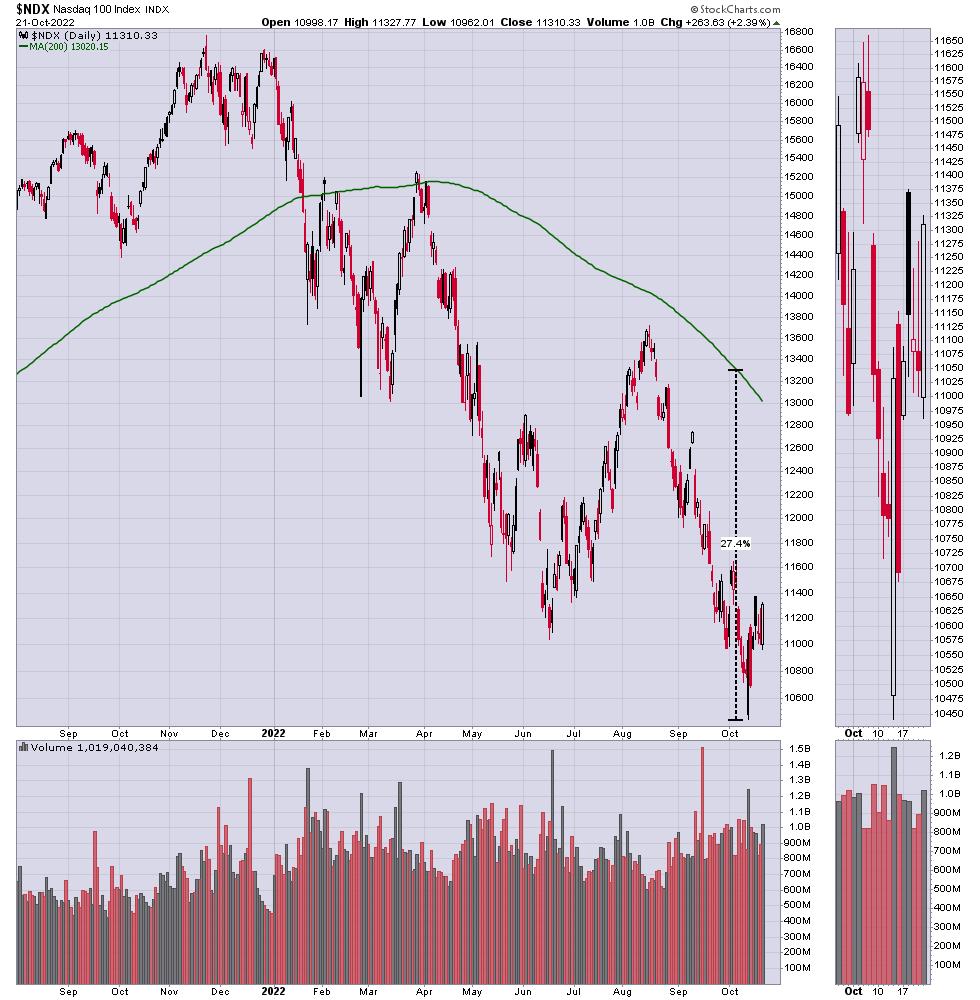
I noticed that the Nasdaq daily chart needed a 25% rally to reach the 200 DMA. That’s a great year for anyone, but the bears continue to hammer on the downside perspective. At some point, even a reversion-to-the-mean trade can make you a lot of money!
I produced this chart the other day, and found it quite interesting. As Apple is one of the biggest companies, I plotted Apple minus the $VIX. Two things from this chart.
1) As the VIX drops and Apple turns up for each rally, this spread will change quickly.
2) Because this difference moves faster than just a price move by Apple, I wondered if it could help alert us when Apple is about to start outperforming the $SPX by giving us an early signal. This would be the purple area. I like the confirmation on all three charts. (Without deeply diving in, there is a place on the two lower charts that could have a shorter tighter trend line being broken in late May, but it wouldn’t have confirmed on the top panel.)
The rally in early June rolled over on the $SPX (lower panel) and made lower lows, trapping people long if you just used those charts. Nothing is perfect, but a few unique charts can help us see the changes in a new light.
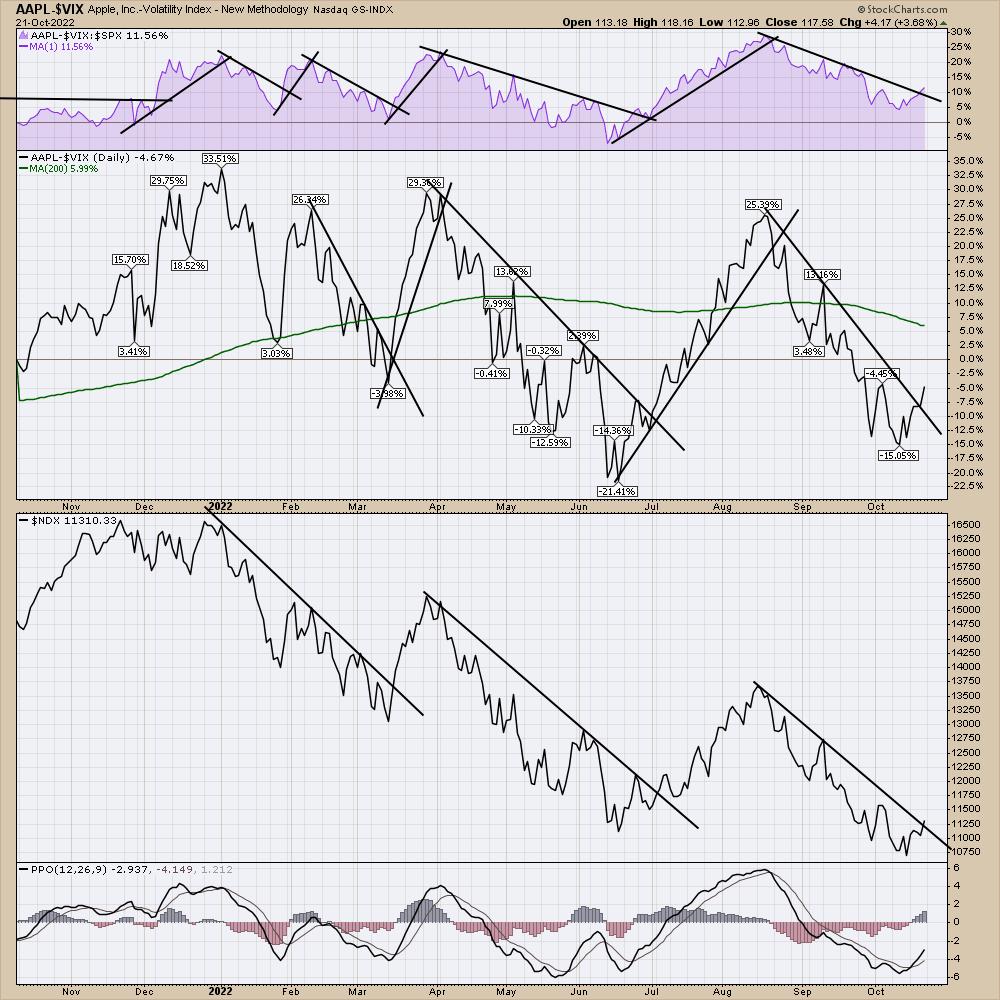
It’s a different chart, but I like how it’s a unique way to monitor an important technology name from a new view. Apple continues to be one of the most dominant companies on the stock exchange.
I have lots of other charts I like to use, having built my library of charts on the StockCharts platform over the last twelve years. I’ll be sharing some of them at an informational webinar next week. The no-cost presentation will be on Tuesday, discussing the tools for how I spot lows and highs in the market, for those that might be interested. Follow this link to register. Nothing wrong with a little education for those inquiring minds; I’d be thankful if you choose to join in.
I know the news is bearish, but some of the charts are downright bullish. Have a good weekend and perhaps we’ll share some optimism by month-end! Right now, I feel a little alone.