

[ad_1]
matejmo/iStock via Getty Images
Investors should take notice of an emerging trend between domestic and foreign stocks. The iShares MSCI EAFE ETF (NYSEARCA:EFA) has bounced sharply off recent lows, and the move comes with impressive relative strength compared to the U.S. stock market.
The relative strength chart below shows that after a period of basing, the performance of EFA against the S&P 500 ETF (SPY) has perked up nicely to the best level in nearly five months. I will lay out why I see this theme continuing in the short and intermediate terms.
EFA vs SPY Relative Chart: EFA Rallies After Basing
Stockcharts.com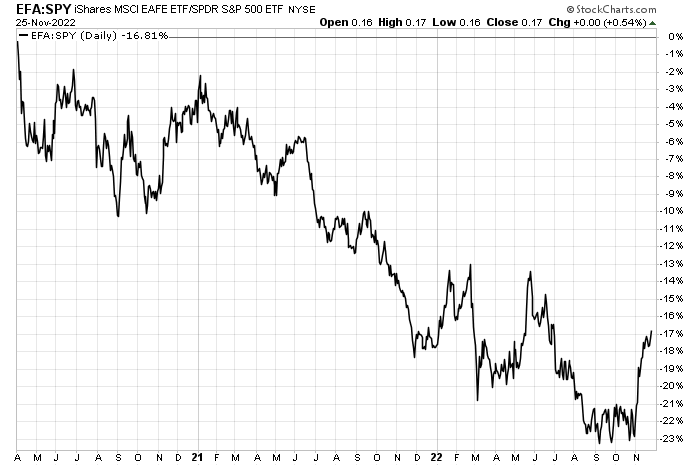
For background, EFA aims to track the investment results of an index composed of large- and mid-capitalization developed market equities, excluding the U.S. and Canada, according to iShares. Investors access equity in more than 800 stocks through the fund with a median 30-day bid/ask spread of just two basis points.
With net assets of more than $46 billion and an average daily volume of more than 23 million shares, it is a liquid way to get your ex-U.S. exposure. Moreover, foreign markets have a much higher yield than the S&P 500 – EFA’s trailing 12-month distribution rate is north of 5% while the forward yield is 4.5%, according to Seeking Alpha.
On valuation, EFA trades at just 13.3 times trailing 12-month earnings. The forward earnings multiple, evidenced by the following chart, is at a sharp discount to the U.S.’s 17.7 P/E at just 12.4. There’s value here.
Forward P/Es: EAFE Regions Are Cheap
Yardeni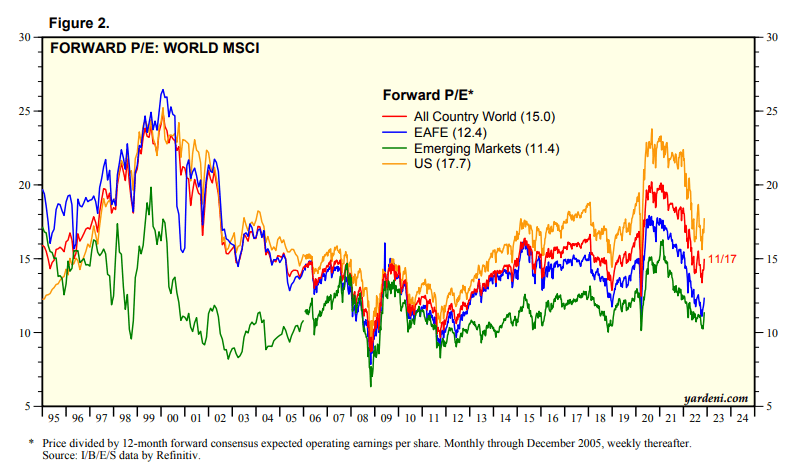
I continue to suggest that investors use IEFA instead of EFA due to the latter’s relatively high annual expense ratio of 0.32%. Regardless of how you play it, there is no doubt that investors are dismissive of ex-U.S. equities right now.
Perusing the Bank of America weekly Flow Show report, I found that European markets, a big part of EFA, have endured a whopping 41 straight weeks of net equity outflows. With much better relative strength, an attractive valuation, and overall investor sourness, now could shape up to be a great time to go overweight EFA.
Investors Continue to Shun European Stocks
BofA Global Research
Also, a key theme persisting in the past two years is the outperformance of value over growth. Notice the sector exposure in EFA – it is heavy into the cyclical value sectors of Financials and Industrials and light in growth Consumer Discretionary, Information Technology, and Communication Services. My general thesis is that the value trade keeps going into 2023.
EFA: More Value-Oriented Compared to the S&P 500
iShares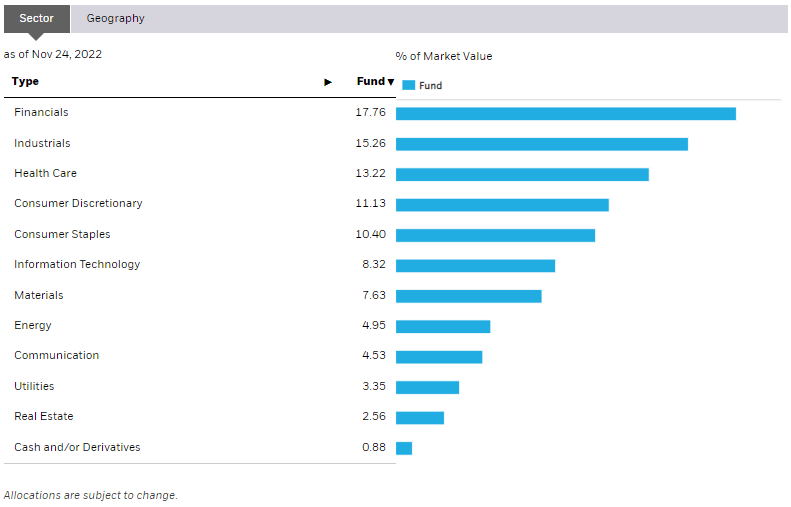
There are many bullish arrows in the quiver, and here’s one more. The U.S. Dollar Index broke through key support several weeks ago. The trend is not definitively lower yet, but the uptrend is gone. That should be a boon for ex-U.S.-domiciles firms just as it was a tough slog for said companies as the DXY rallied.
Dollar’s Pain, EFA’s Relative Gain
TradingView
The Technical Take
EFA has bullish features on the daily chart. I was bearish on the fund back in August, and that proved to be a good call as foreign-developed equities went on to make fresh lows following a summer rebound. The tides have turned, however.
Notice in the chart below that shares have rallied above the 200-day moving average for the first time since January. The S&P 500, meanwhile, is still below that long-term trend indicator.
EFA settled at the highest price since early June last Friday – near the peak of the week, though volume has been admittedly light lately. What I like, though, is that the move higher in price is confirmed by a strong RSI momentum reading – no bearish divergence here. I see key support near $60 while $71 could be the first spot of near-term selling.
But with an overall break of the downtrend off the high at the start of the year, I see more upside potential in EFA.
EFA: Shares Breaking Above the 200-Day, Confirmed by RSI
Stockcharts.com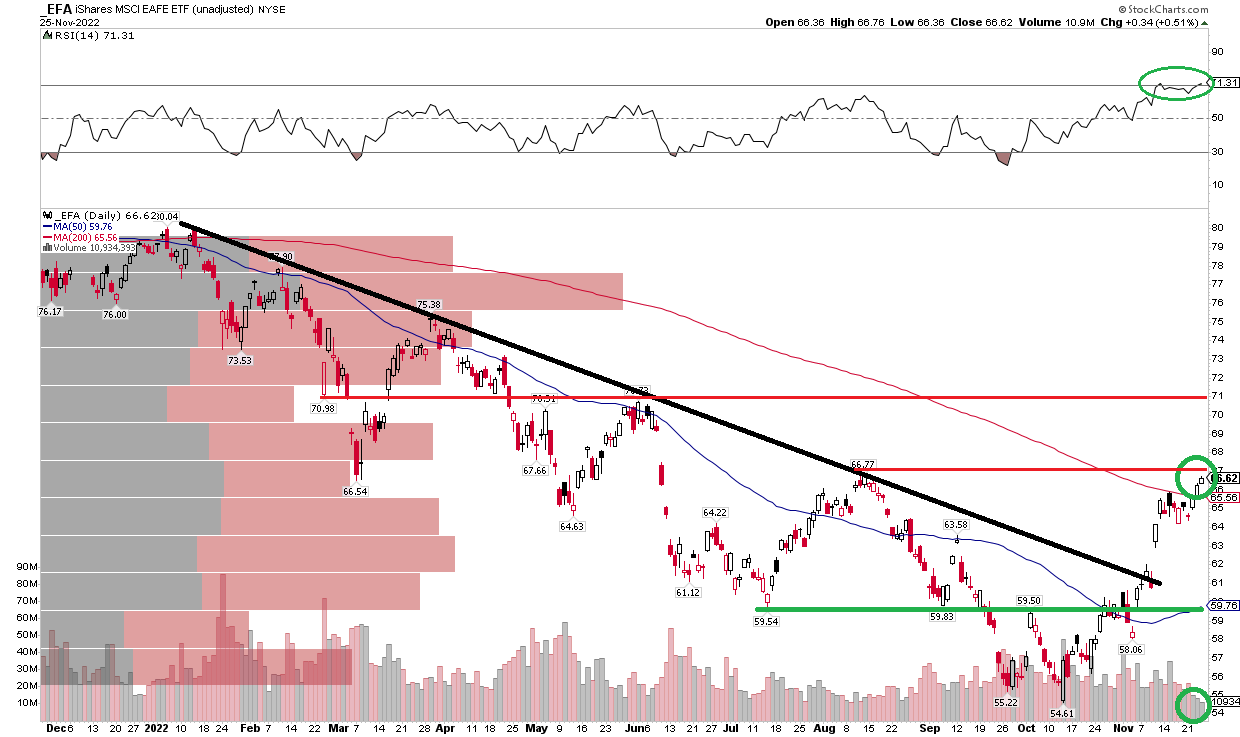
The Bottom Line
EFA has rallied more than 20% from its October nadir, but I assert there is more relative and absolute upside potential in this broad foreign equity ETF. Long here through next year should prove to be a good allocation strategy.
[ad_2]
Image and article originally from seekingalpha.com. Read the original article here.