

[ad_1]
Khanchit Khirisutchalual
What does the future hold for the dividends of the S&P 500 (SPX) now that we’re reaching the end of the third quarter of 2022?
We’re now in the gap between when the index’s dividend futures contracts for 2022-Q3 have expired and the actual end of the calendar quarter. We find the outlook for the S&P 500’s quarterly dividends per share improved since we checked them near the end of 2022-Q2. What’s more, we also have a first look for dividend futures data extending through the end of 2023. The following chart reveals those expectations before the start of trading on Monday, 26 September 2022:
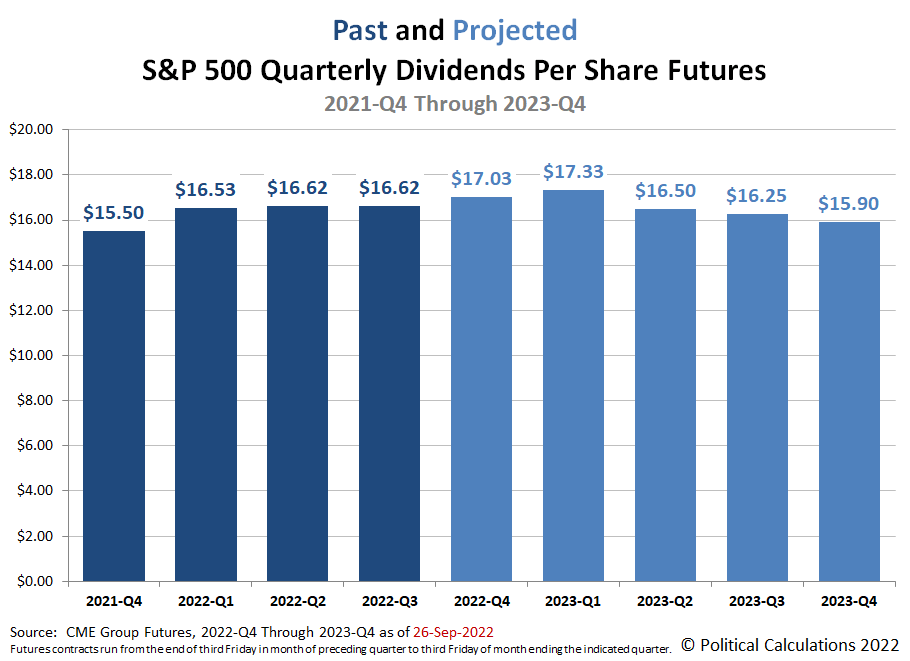
Here’s how the dividend futures forecast has changed for each quarter for which we presented data at the end of 2022-Q2:
- 2022-Q3: Up $0.29 per share.
- 2022-Q4: Up $0.63 per share.
- 2023-Q1: Up $0.73 per share.
- 2023-Q2: Up $0.40 per share.
As interest rates rise and recessionary pressures increase, we’re starting to see firms like FedEx (FDX) dial back their earnings forecasts, though not yet their dividends. It’s an open question of how long that state of affairs can continue.
About Dividend Futures
Dividend futures indicate the amount of dividends per share to be paid out over the period covered by each quarter’s dividend futures contracts, which start on the day after the preceding quarter’s dividend futures contracts expire and end on the third Friday of the month ending the indicated quarter. So for example, as determined by dividend futures contracts, the “current” quarter of 2022-Q3 began on Saturday, 18 March 2022 and will end on Friday, 16 September 2022.
That makes these figures different from the quarterly dividends per share figures reported by Standard & Poor’s, who reports the amount of dividends per share paid out during regular calendar quarters after the end of each quarter. This term mismatch accounts for the differences in dividends reported by both sources, with the biggest differences between the two typically seen in the first and fourth quarters of each year.
Reference
The past and projected data shown in this chart is from the CME Group’s S&P 500 quarterly dividend index futures. The past data reflects the values reported by CME Group on the date the associated dividend futures contract expired, while the projected data reflects the values reported on 27 June 2022.
Editor’s Note: The summary bullets for this article were chosen by Seeking Alpha editors.
[ad_2]
Image and article originally from seekingalpha.com. Read the original article here.