

[ad_1]
RiverRockPhotos
Recently, I reviewed the SPDR S&P North American Natural Resources ETF (NANR), noting the success of natural resource companies in the past few years. This article reviews its larger and more well known sibling, the SPDR S&P Global Natural Resources ETF (NYSEARCA:GNR).
Like the NANR, the GNR ETF provides exposure to natural resource companies, but its investments are made globally.
I personally prefer the NANR, as it has a bigger weighting to energy companies. Energy markets are expected to remain tight in spite of an incoming recession, due to the Russian/Ukraine war.
Fund Overview
The SPDR S&P Global Natural Resources ETF provides exposure to global natural resource companies. It is one of the largest natural resources-focused ETFs with over $3 billion in assets.
Strategy
The GNR ETF tracks the S&P Global Natural Resources Index (“Index”). The index is comprised of the 90 largest companies by market cap in the natural resources and commodities industries. The index comprises stocks in 3 sub-industries: energy, metals & mining, and agriculture. Each sub-industry has a maximum 40% weight allocated to U.S. stocks, and a 15% maximum weight to emerging market stocks. Individual stocks are capped at 5% weight, and the maximum weight of each sub-industry is capped at 1/3 of the total weight of the index.
Portfolio Holdings
As of November 22, 2022, the GNR ETF has the sector allocation shown in Figure 1.
Figure 1 – GNR ETF sector breakdown (ssga.com)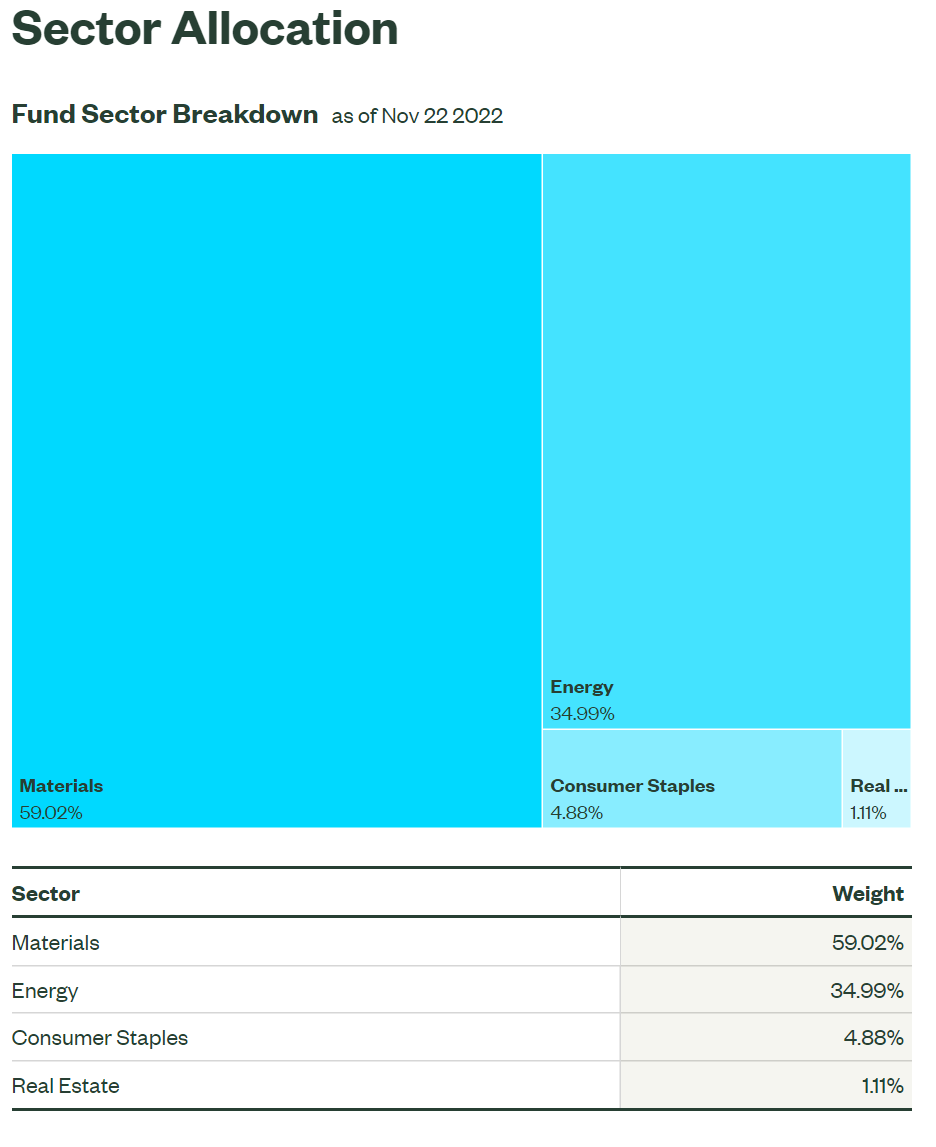
Figure 2 shows the fund’s geographical breakdown.
Figure 2 – GNR ETF geographical breakdown (ssga.com)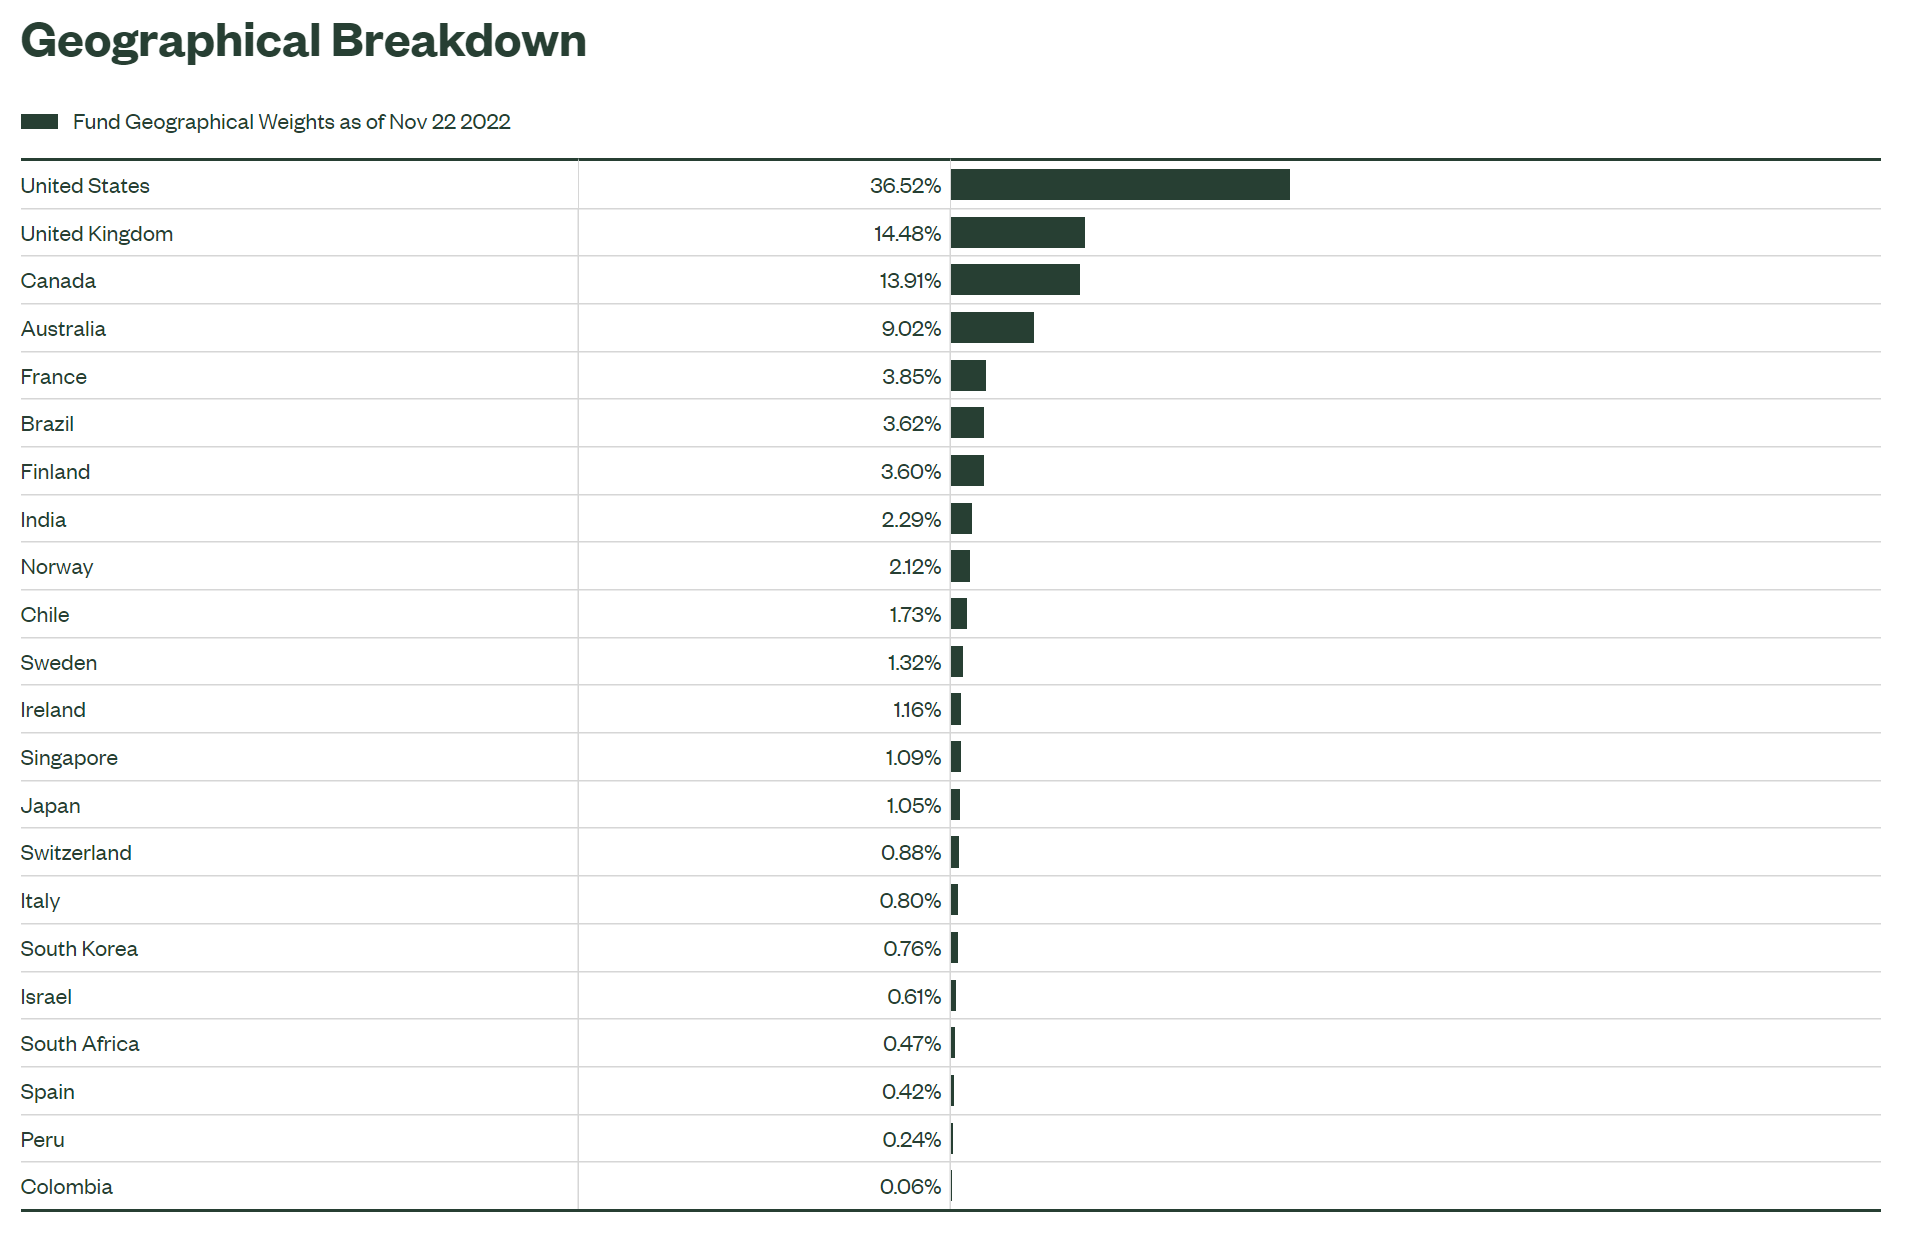
Returns
The GNR ETF has performed well so far in 2022, returning 3.2% while the market has suffered a large drawdown. However, GNR’s longer term returns have not been stellar, only returning 6.6% and 3.8% per year on a 5 and 10 Yr basis, to October 31, 2022 (Figure 3).
Figure 3 – GNR ETF returns (ssga.com)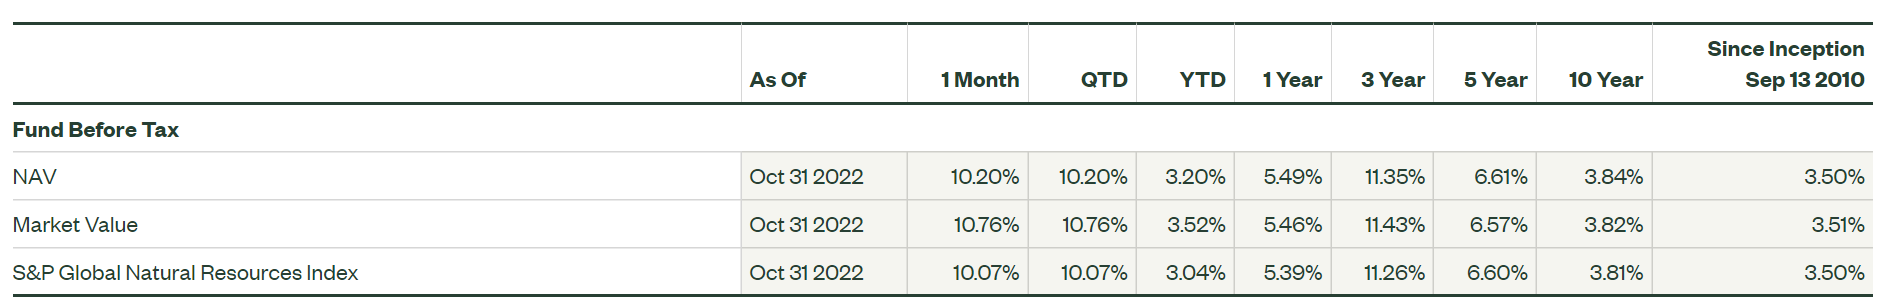
Distribution & Yield
The GNR ETF pays a modestly high distribution yield of 3.9% on a trailing 12 month basis. GNR’s distribution is paid semi-annually and is variable.
Figure 4 – GNR ETF distribution (Seeking Alpha)
Fees
The GNR ETF charges a 0.40% expense ratio.
GNR vs. NANR
In my recent NANR article, I noted that resource funds have a distinct ‘boom/bust’ cycle, depending on whether supply/demand factors favour rising or falling commodity prices. The same conclusion can be applied to the GNR ETF (Figure 5).
Figure 5 – GNR ETF exhibits boom / bust returns (morningstar.com)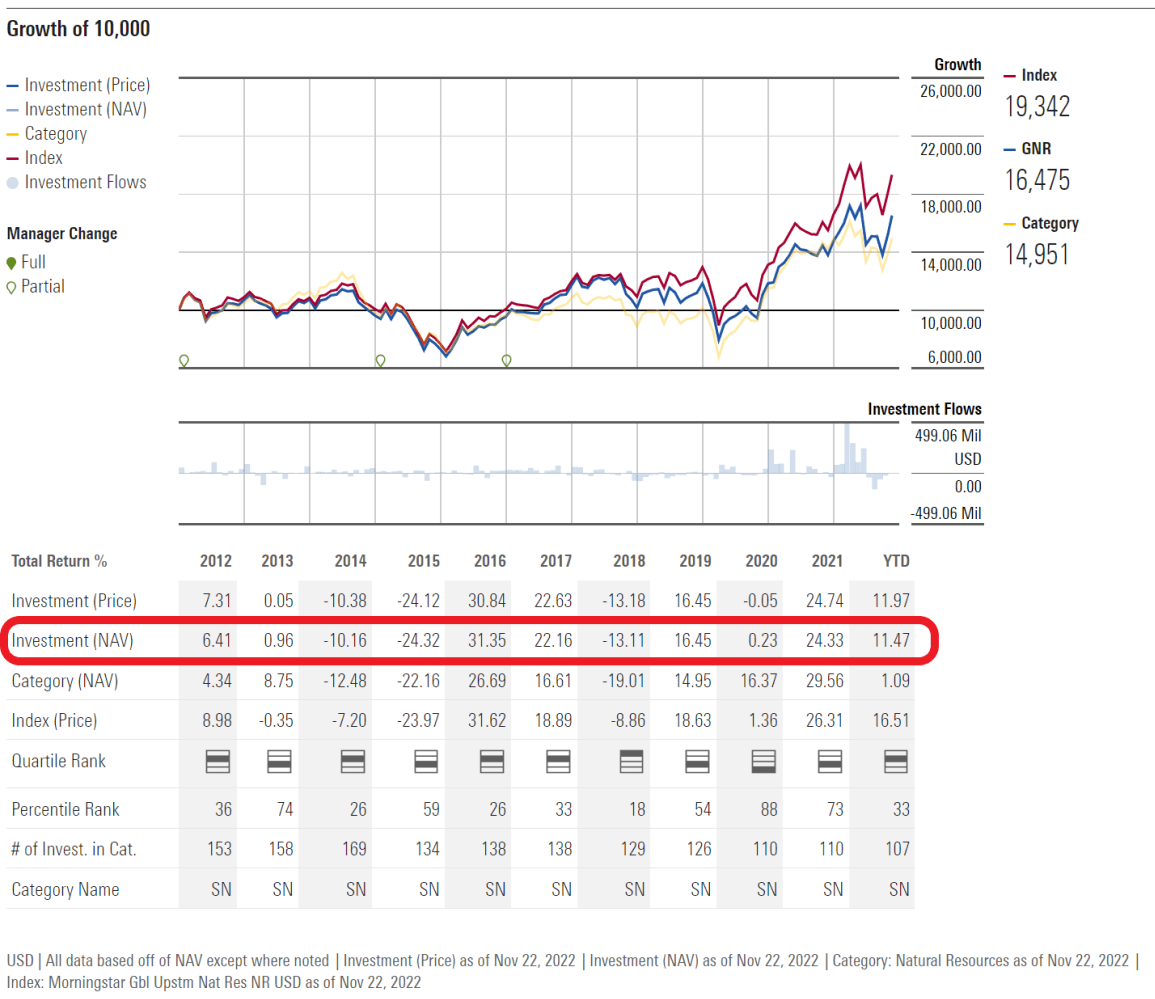
The major difference between the two funds is the fact that the NANR focuses on North American companies, which tend to be more heavily weighted in the energy sector, as NANR has a 46.3% weight in the energy sector vs. 35.0% for GNR. On the other hand, GNR has a bigger weight in materials, with a 59.0% weight.
Energy Has Outperformed Materials…
In the past few years, energy has outperformed materials, as represented by ratio between the Energy Select Sector SPDR Fund (XLE) and the Materials Select Sector SPDR Fund (XLB) (Figure 6).
Figure 6 – XLE has outperformed XLB (Author created with price chart from stockcharts.com)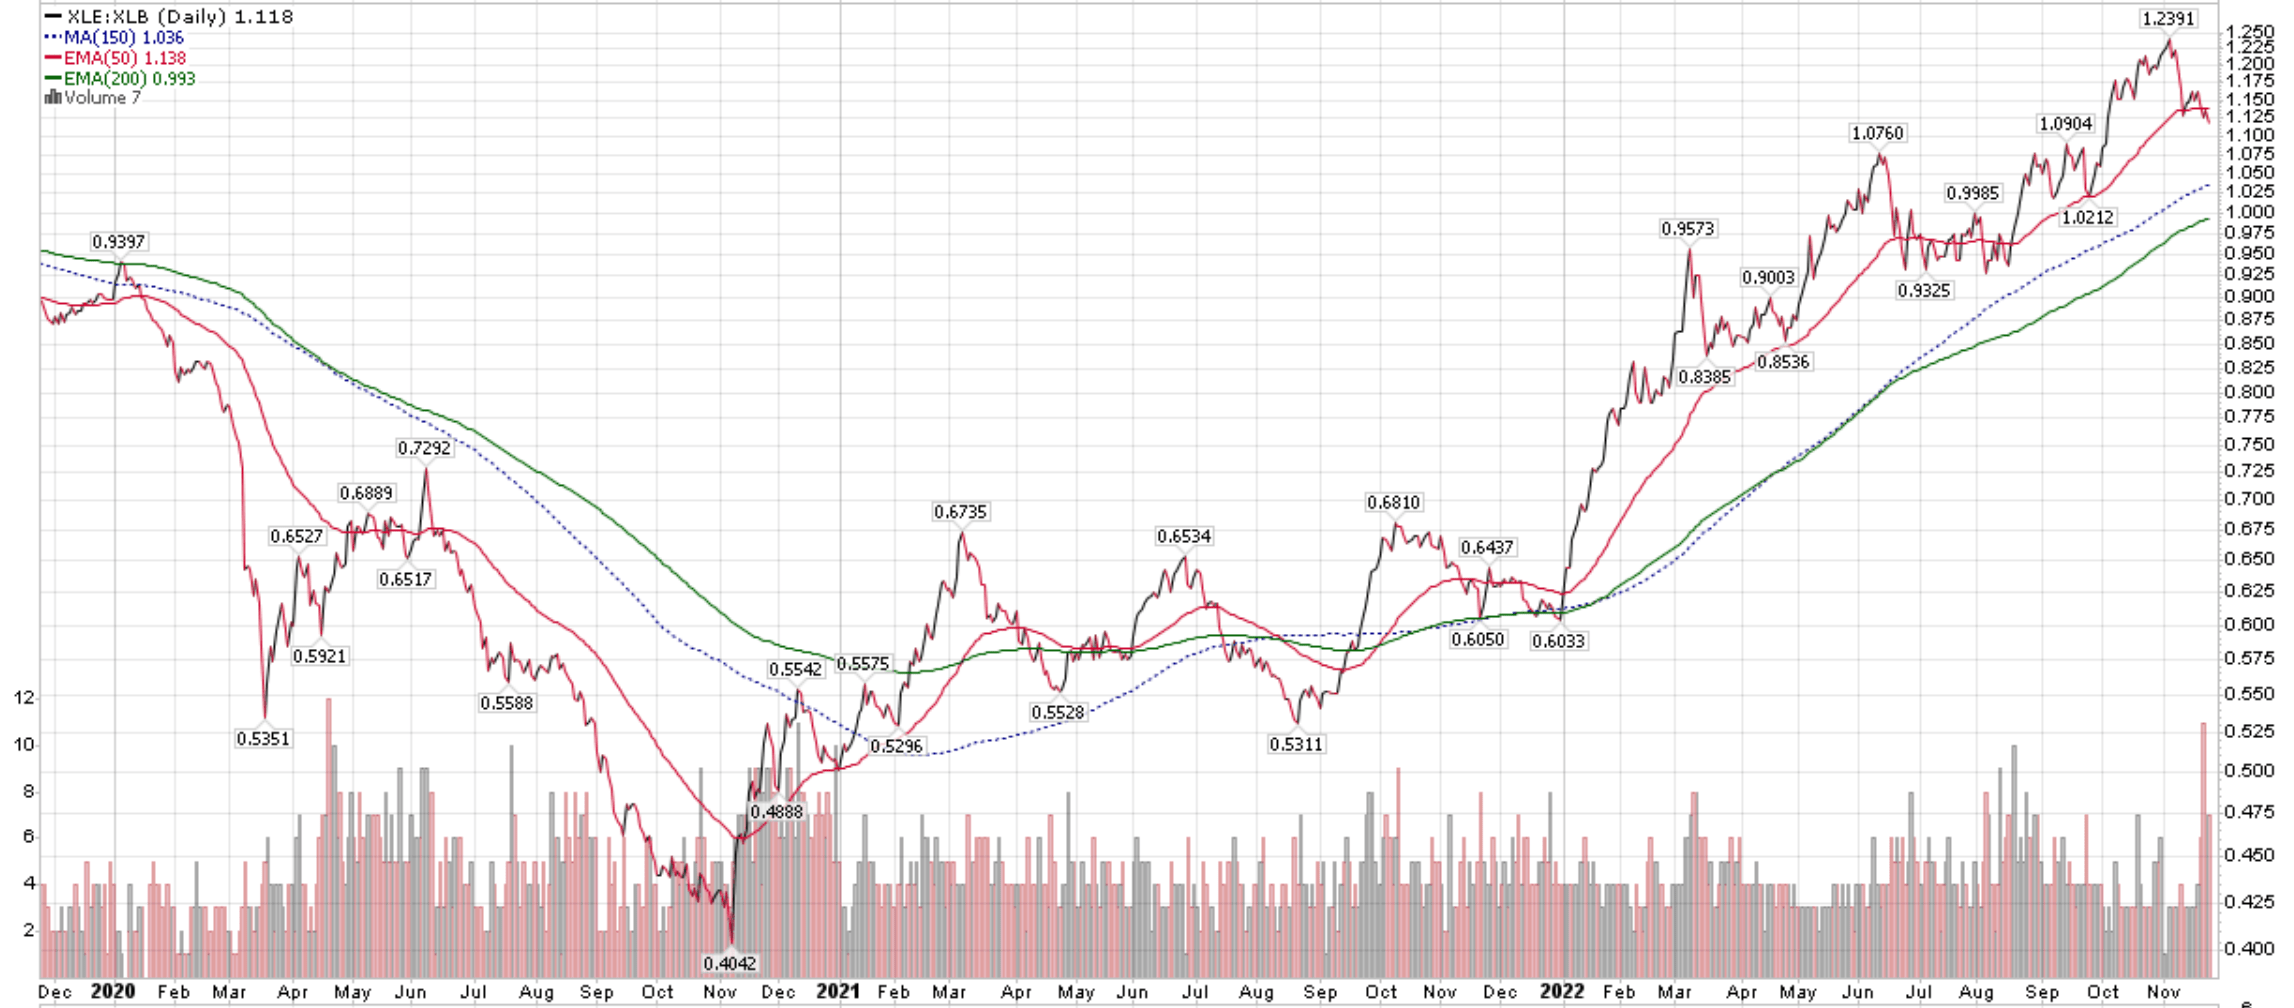
…And North America Has Outperformed The World…
Another factor favouring NANR is its focus on North American equities, which have outperformed their global peers. For example, within the energy sector, U.S.-based Exxon Mobil (XOM) has vastly outperformed U.K.-based Shell PLC (SHEL), even though both are global energy conglomerates (Figure 7).
Figure 7 – XOM has outperformed SHEL (Author created with price chart from stockcharts.com)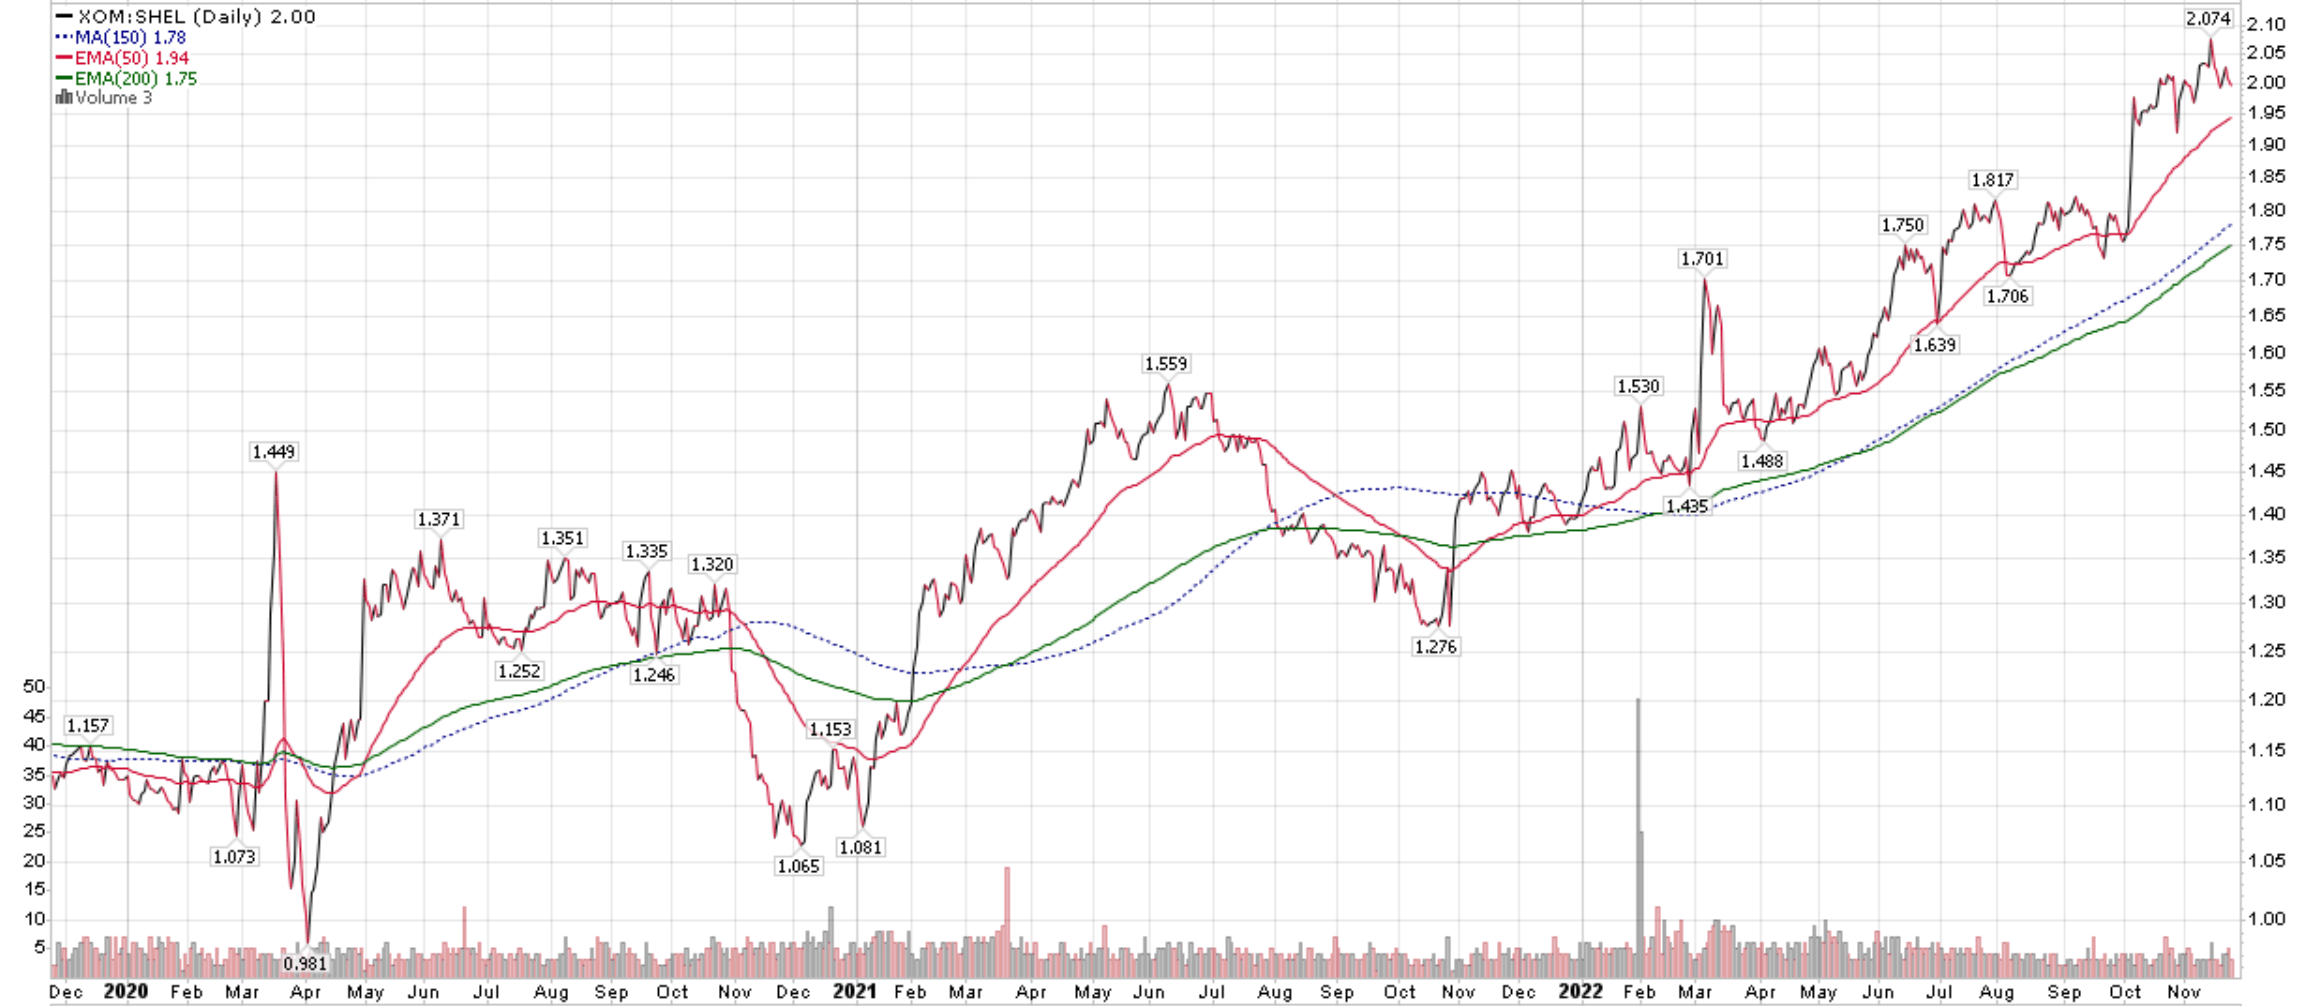
This is partly because investors have been redeeming European funds, and partly because European companies face unfavourable policy headwinds like windfall taxes.
…Leading To NANR Beating GNR
Therefore, the NANR ETF has outperformed the GNR ETF (Figure 8).
Figure 8 – NANR outperformed GNR (Author created with price chart from stockcharts.com)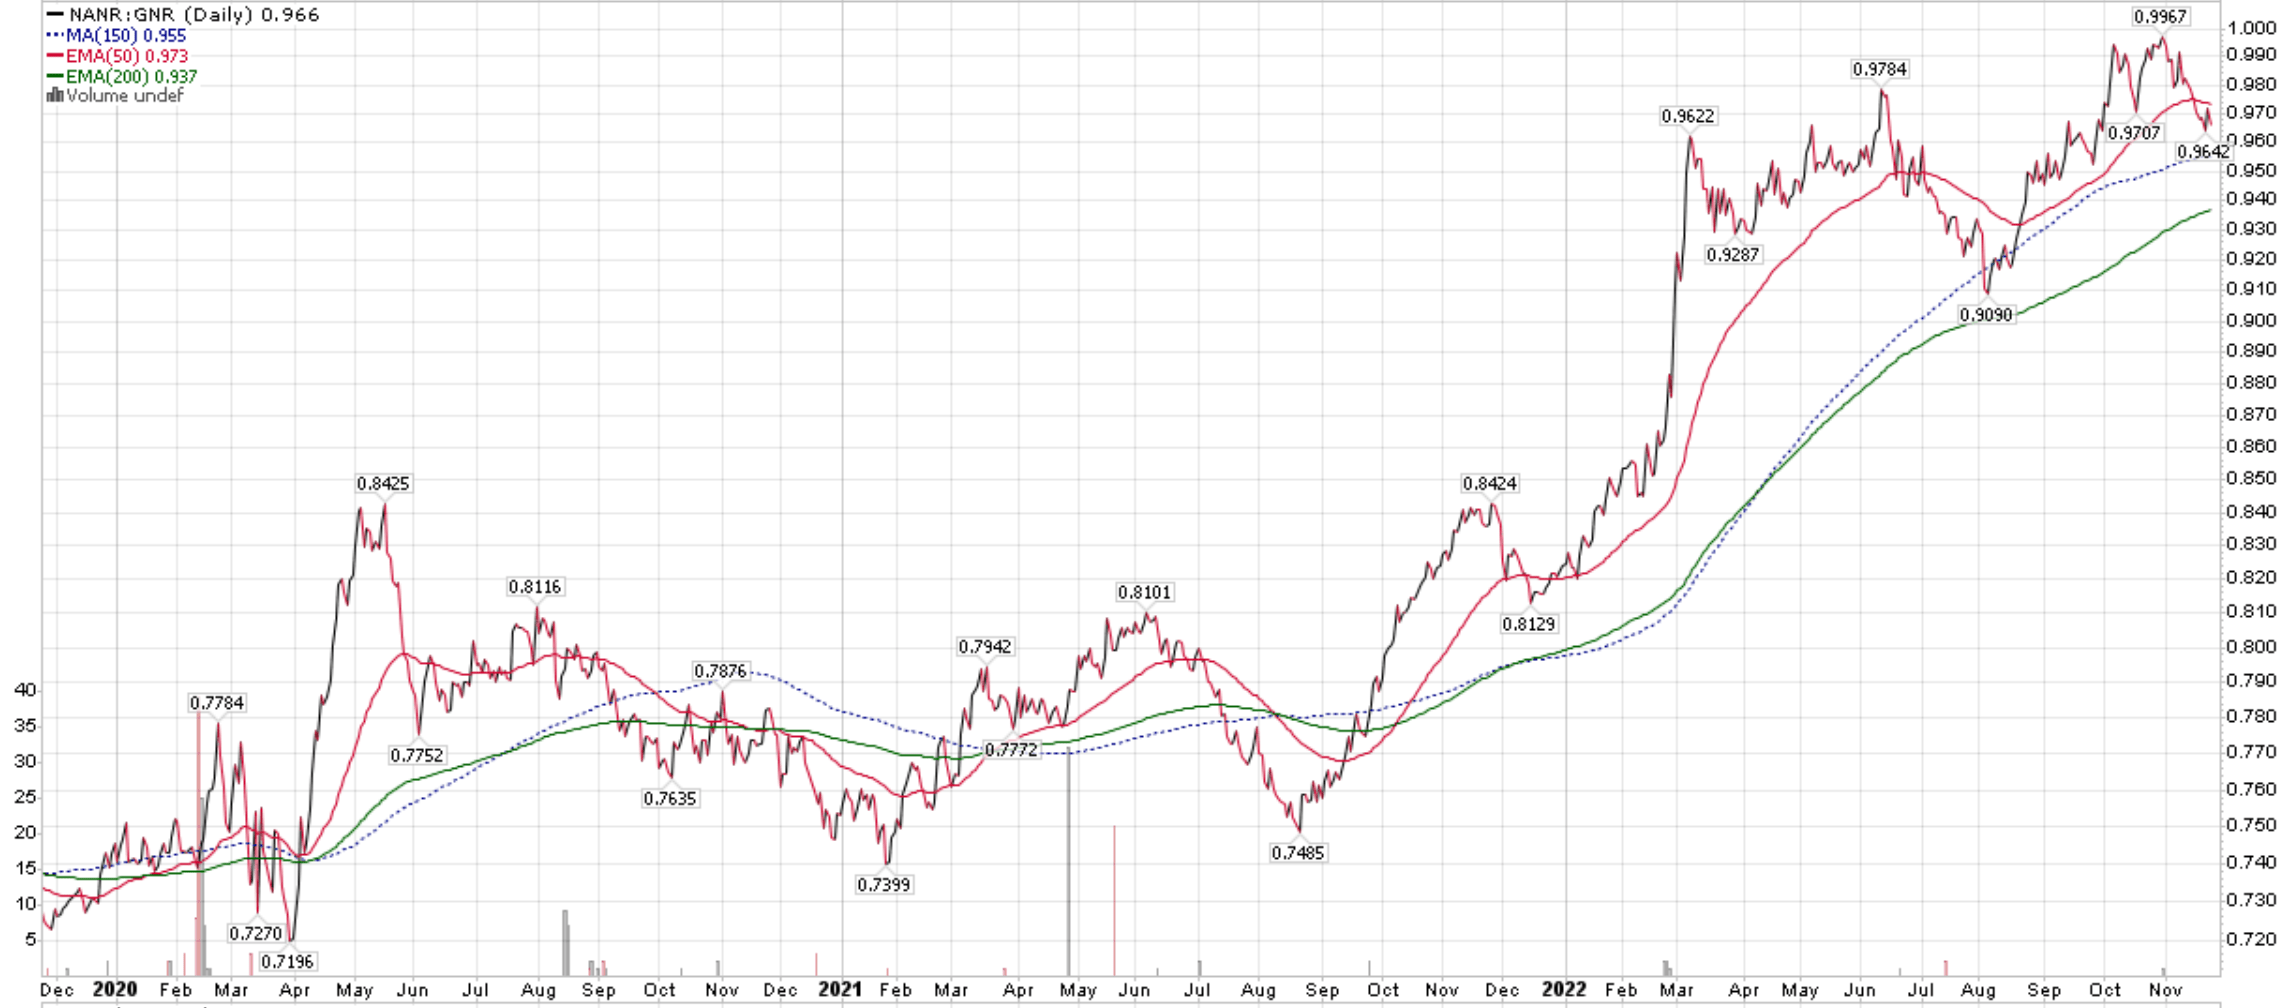
Recession Is A Risk To GNR
Similar to NANR, the GNR ETF is susceptible to a global economic slowdown. In recent months, we have seen economists and financial indicators increasingly suggest a global recession is in the cards for 2023.
In fact, the November S&P Global Flash U.S. Composite PMI reading of 46.3 suggests the recession is already here, with both services and manufacturing PMI readings missing estimates by a wide margin. S&P Global Market Intelligence’s Chief Business Economist has the following comment on the PMIs: (author highlight added for emphasis)
Business conditions across the US worsened in November, according to the preliminary PMI survey findings, with output and demand falling at increased rates, consistent with the economy contracting at an annualised rate of 1%.
Conclusion
The GNR ETF provides exposure to global natural resource companies. Natural resource equities have been big winners in recent years, as the world struggled with supply constraints and resumption of demand post the COVID pandemic. However, economic storm clouds are brewing as we look forward to 2023.
While GNR has provided positive returns YTD, it has lagged the NANR ETF, which focuses on North American companies and has a larger weighting to in-demand energy equities. Between the two funds, I think the fundamental picture is brighter for NANR, as energy remains a key global issue with the Russian/Ukraine war supporting higher energy prices.
[ad_2]
Image and article originally from seekingalpha.com. Read the original article here.