[ad_1]
Gold Talking Points:
- Gold prices have been on the move in Q3. Gold put in a strong rally from late-July and through the first-half of August after running into a significant spot of support.
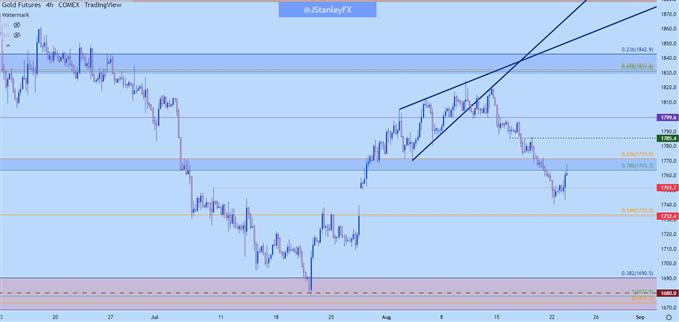
- Two weeks ago I pointed out a rising wedge formation that opened the door for bearish reversal potential. That formation filled-in last week and gold continued to breakdown through this week’s open.
- Overnight, gold has found support and wiggled back for a resistance test at a prior support zone.
- The analysis contained in article relies on price action and chart formations. To learn more about price action or chart patterns, check out our DailyFX Education section.
It’s been a busy summer for gold prices. The yellow metal came into the season with a bit of hope. Prices had found a low in mid-May and buyers were starting to take-control, bidding prices back-above the 1800 psychological level and, eventually, up for a test of confluent Fibonacci resistance around the 1880 level.
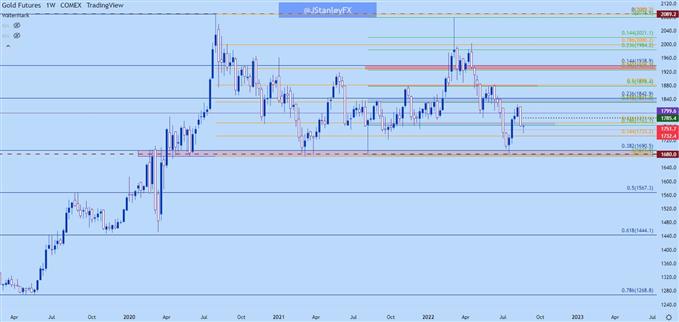
But, as shared then, that recovery was un-even, and price action built into a rising wedge formation. Such formations are often tracked with the aim of bearish reversals – and reverse it did. A slalom developed in price action in mid-June and largely continued into the second-half of July. All the way until support came into play around the 1680 level. That’s a big price, as it’s now been tested on three separate occasions since gold topped-out in the summer of 2020.
That support test led to another strong topside run. But, again, the move was uneven, and price built into a rising wedge formation.
That one began to breakdown earlier this month and last week was particularly painful, as gold prices sold off each day Monday-Friday. That weakness ran through this week’s open, with price moving all the way down to 1740 before starting to bounce.
Gold Eight-Hour Price Chart
Chart prepared by James Stanley; Gold on Tradingview
Gold Short-Term
On a shorter-term basis, we now have a resistance test at prior support, in a zone marked by two Fibonacci levels that creates a bit of confluence. This zone runs from 1763-1771, and there’s already been a response from sellers. A hold of resistance below 1763 through the end of today would keep the door open for bearish continuation potential, although that may be a bit early. Looking-higher on the chart, and there may be more attractive spots for lower-high resistance, such as a test of 1771 or, perhaps even the support-turned-resistance that’s at 1785.
Gold Four-Hour Price Chart
Chart prepared by James Stanley; Gold on Tradingview
Gold Bigger-Picture
Taking a step back on gold and we’re in a range. This range has been holding since Gold topped-out in 2020 and pulled back to support at 1680 in early-2021.
Given fundamentals, I’m biasing this range in a bearish fashion but that doesn’t come alive until sellers are finally able to test through support. If, and this is a big if, sellers can hold the line here, we may end up with that fourth support test in the 1680 area, and that test may finally allow for a bearish breakdown.
In the meantime, gold price action is essentially working within pre-defined technical criteria produced by this past two-plus years of range-like price action.
Gold Weekly Price Chart
Chart prepared by James Stanley; Gold on Tradingview
— Written by James Stanley, Senior Strategist, DailyFX.com & Head of DailyFX Education
Contact and follow James on Twitter: @JStanleyFX
[ad_2]
Image and article originally from www.dailyfx.com. Read the original article here.


