

[ad_1]
What’s happenin’ everyone?
I don’t know about you, but between purchasing and returning gifts, all of the standing on lines this Christmas season has made me a bit grumpy.
(Full disclosure: I am not the “queen of everything” as the coffee cup states)
In my mind, by now a good portion of the frustration that comes with making transactions at a brick-and-mortar store should be avoidable.
After all, it’s almost 2023!
You’d think by now that retail cashiers would have new tools and methods to replace the inefficient procedures they are still using.
I bring this up because I have been communicating with members of my Terminator Trades chat room recently, in an effort to find out what their New Year’s resolutions are when it comes to trading.
You know what one of their top resolutions was?
To become a more efficient trader.
Look, I get it.
There is a HUGE universe consisting of thousands of stocks and ETFs to choose from.
So, by inefficiency, I mean that these traders want to spend far less time looking for ideas with the greatest potential to move “quickly.”
Now, notice I didn’t say move “big.”
That’s because successful traders look for trades where risk is well defined and manageable and where the probability of a successful trade, not an explosive trade, is high.
And to be a successful options trader goes even further.
To be a successful options buyer, you also need to know how to find options that are poised to appreciate faster than Theta (time decay of options prices).
That’s why I tell my members to use tools that are effective at finding not only sector rotation but the BIG “Smart Money” flows to back it up!
Here’s how it all comes together, friends.
When I perform top-down analysis, one of many tools I use to find sector rotation is the Relative Rotation Graph (RRG).
Teachable Moment:
Relative Rotation Graphs are readily available on a number of charting platforms these days. Today, we’ll be using the version provided on the Stockcharts.com website.
Stockcharts.com describes RRG charts as follows: RRG® charts show you the relative strength and momentum for a group of stocks. Stocks with strong relative strength and momentum appear in the green Leading quadrant. As relative momentum fades, they typically move into the yellow Weakening quadrant. If relative strength then fades, they move into the red Lagging quadrant. Finally, when momentum starts to pick up again, they shift into the blue Improving quadrant.
The comparisons are made relative to some benchmark, which in most cases is the S&P 500.
When applied to the Dow Jones Retail Index, this analysis produces something that look like this:
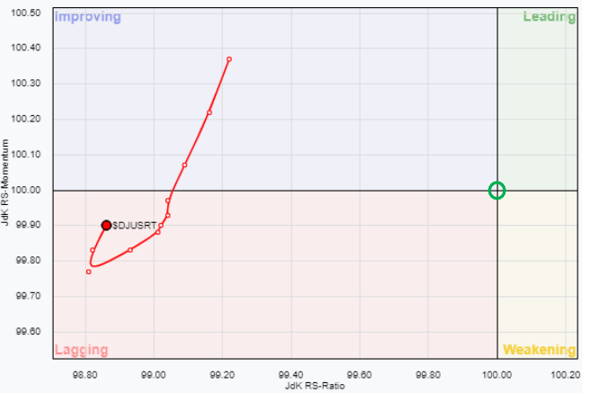
Though not visible on the top rotation graph, the S&P 500 ETF (SPY) is positioned at the origin (where the X and Y axis meet at the green circle), while any sectors that are being analized will either be Leading, Weakening, Lagging or Improving relative to the S&P 500.
So what this chart is telling me is that, after severely Lagging relative to the S&P 500, the Retail Sector ETF has begun to make a U-turn and may soon move into the Improving quadrant vs. the S&P 500.
With that information, I decided to keep a close eye out for stocks with unusually large options trades in the retail sector.
And that’s where I take the next step in my process, by bringing in a set of tools that you simply will NOT find as part of any basic charting platform.
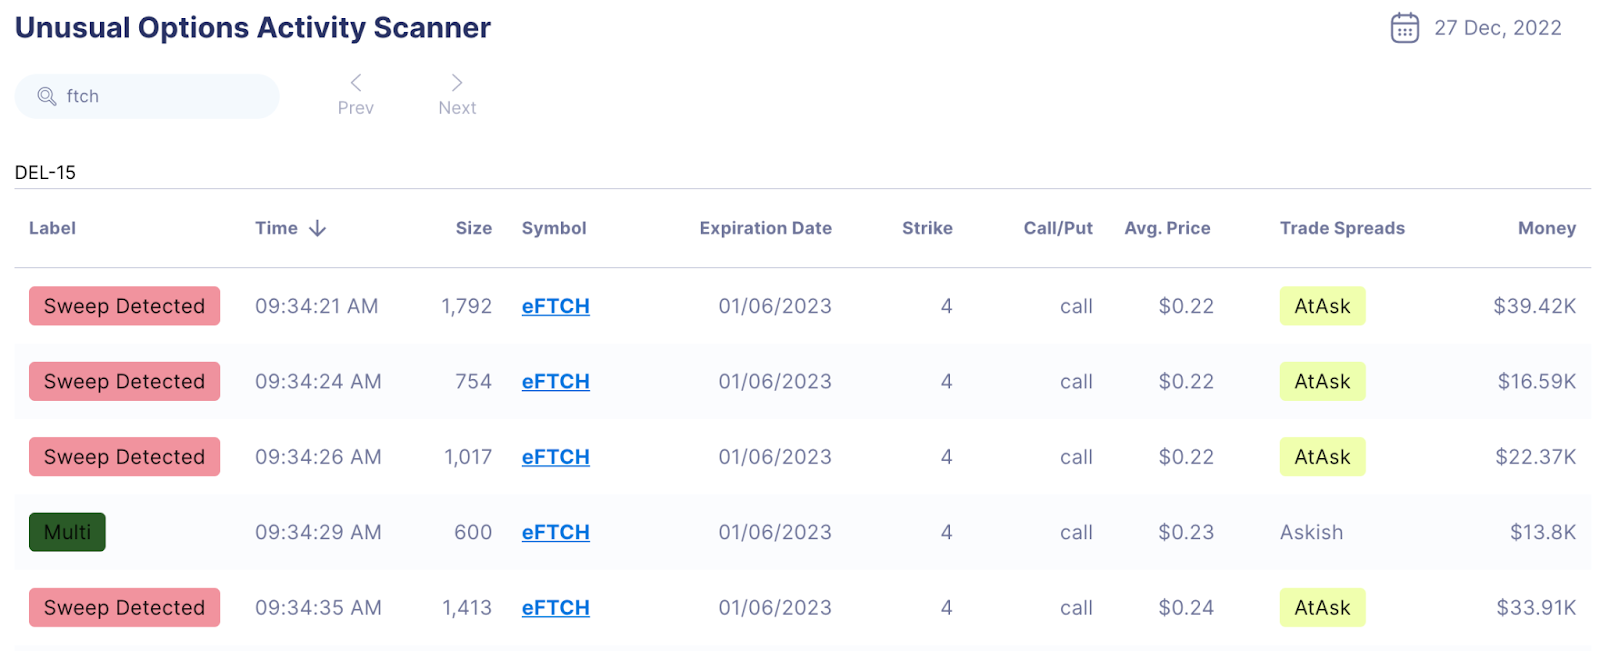
Friends, my premium and customizable Unusual Options Activity and Dark Pool Scanner are at the core of my trading, and they are the reason I have been able to teach so many wonderful retail traders as part of my Terminator Trades service.
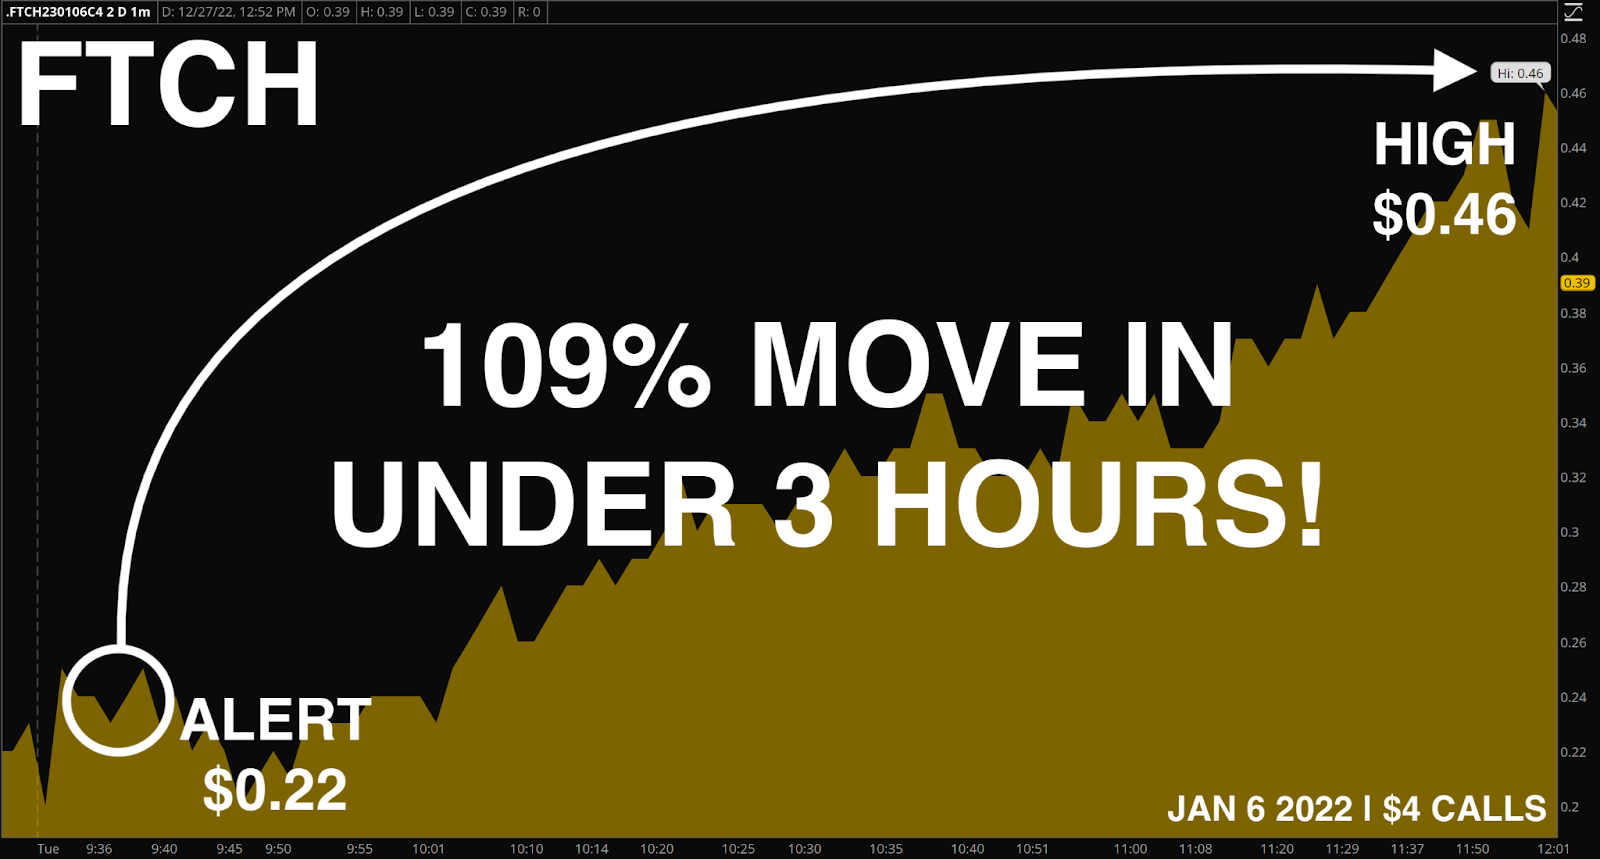
FTCH is a luxury retailer that I have been keeping an eye on recently, just waiting for the right conditions to come together for a great trade idea.
So when I saw the cash piling into the $4 CALLS with the 01/06/2023 expiration on Tuesday, I did not hesitate to let my Terminator Trades members know my plan.
I quickly sent this instant alert to my audience via the RagingBull App…
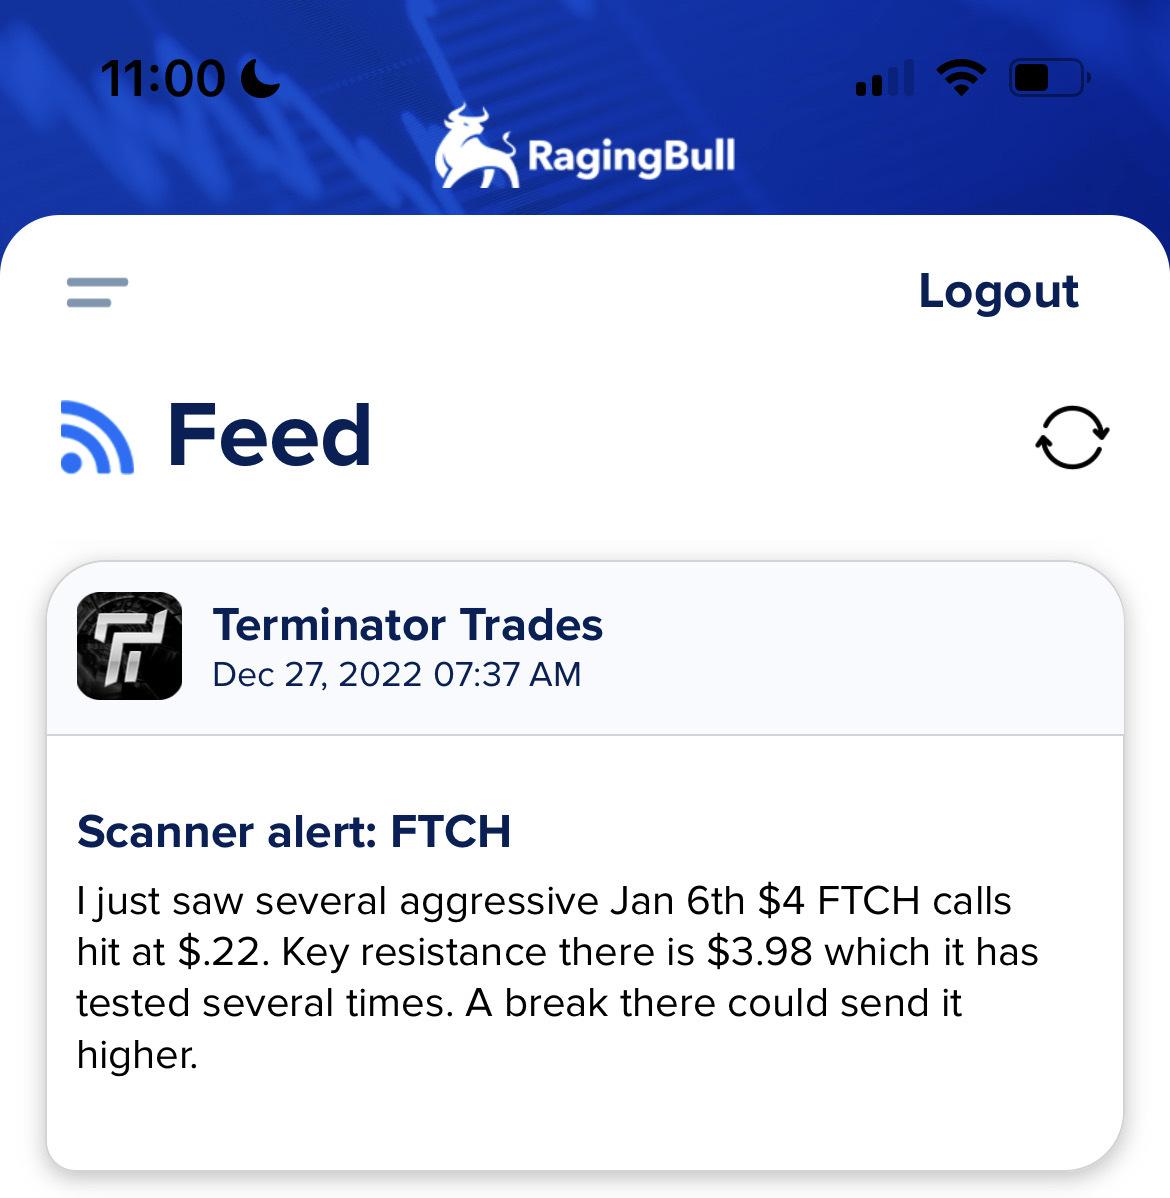
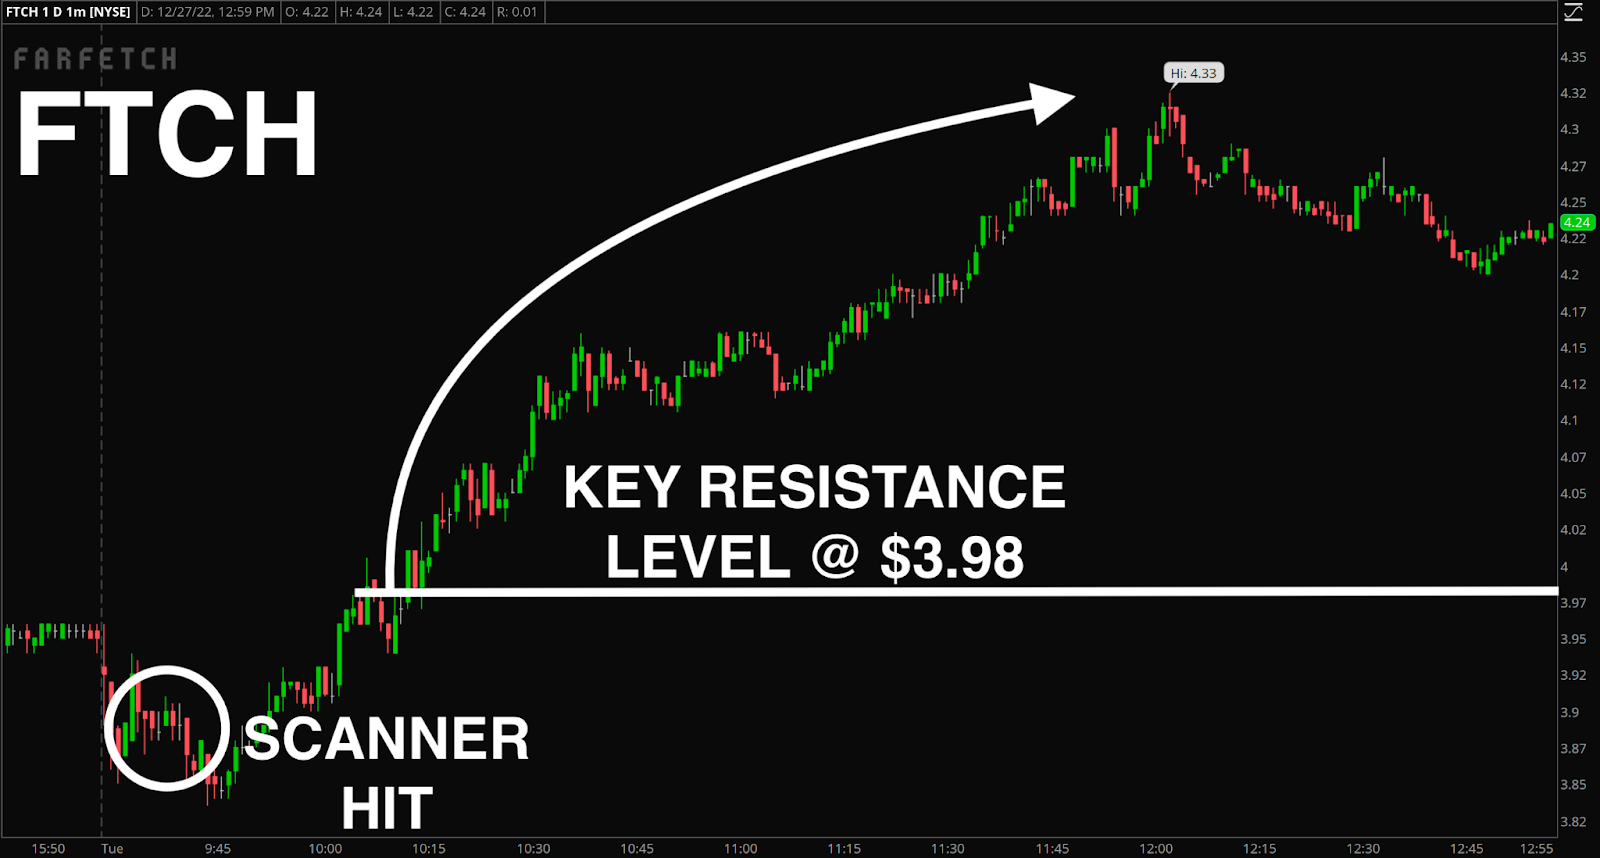
And not long after that app alert, FTCH broke through that key resistance, and shot up to a high of $4.33 within a few hours…
Now, you know I’m all about options, and that’s where the story gets juicy…
Because those $4 CALLS on FTCH more than DOUBLED, for a 109% move in under 3 hours!
That, my friends, is what you call efficient trading!
If you’re sick of buying options and watching them whither to nothing as you wait for the underlying stock to move, I have a special treat for you.
Just in time for year-end, my buddy, RagingBull’s CEO Jeff Bishop, is giving me the go ahead to offer UNBELIEVABLE discounts of 57% and 50% Terminator Trades plans right now (there are only 2 options currently available, as Terminator MAX is closed and only available to ELITE members).
There has never been a better time to learn directly from me than during this Year-End “blowout” sale.
Just look at all the amazing premium resources you’ll have access to:
- The Unusual Options Activity Scanner
- The Dark Pool Scanner
- The SKYNET Dynamic Watchlist
- App Alerts with trade ideas from the smart-money scanners
- The RESISTANCE Video Training Camp
- Daily morning email with more trade ideas, updates, and smart-money news
Unfortunately, this limited-time blowout sale ends soon!
Don’t miss this incredible opportunity…
And don’t miss the next smart-money trade ideas I’ve got lined up for Terminator Trades!
[ad_2]
Image and article originally from ragingbull.com. Read the original article here.