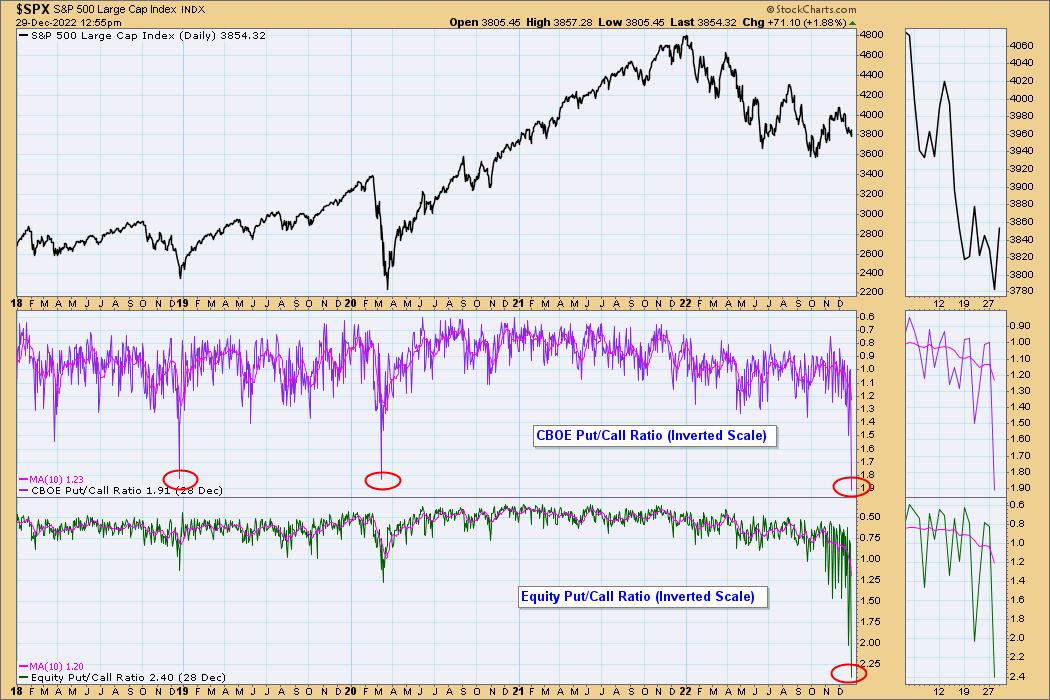
This morning on the Fox Business Channel someone made a point to mention how extreme the Put/Call Ratio has gotten. Typically I don’t pay a lot of attention to this indicator because it is hard to interpret, but when I looked at it this morning, it certainly provided a wake-up call. Our primary interest is in the CBOE Put/Call Ratio, but I have also included the Equity Put/Call Ratio because it is so far out of its normal range. To calculate the Put/Call Ratio, divide the number of puts by the number of calls. High readings indicate excessive bearishness, and the current readings are the highest ever. We can see on this chart that in the last five years prior high readings have occurred at important market bottoms.
Watch the latest episode of DecisionPoint on StockCharts TV’s YouTube channel here!

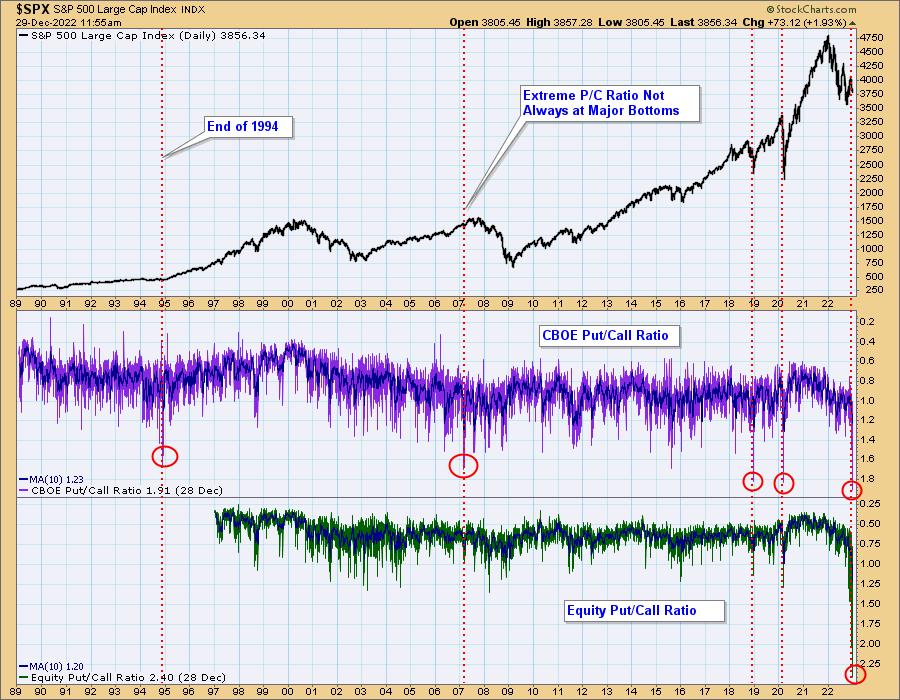
Historically, stand-out Ratio spikes tend to occur at significant price lows. Some exceptions below are: (1) the end of the 1994 consolidation, and (2) the extreme ratio reading in 2007 near the bull market top. Also, the Equity Put/Call Ratio has been at extreme highs for over two months. How and when is one supposed to act on that?
Conclusion: Current high Put/Call Ratio readings reflect extremely high bearish sentiment. Such extremes typically identify major price lows, and it would pay the bears to stay alert to their increased vulnerability; however, this indicator is not infallible or precise. Be careful regardless of your inclinations.
–Carl Swenlin
Technical Analysis is a windsock, not a crystal ball. –Carl Swenlin
(c) Copyright 2022 DecisionPoint.com
Helpful DecisionPoint Links:
DecisionPoint Alert Chart List
DecisionPoint Golden Cross/Silver Cross Index Chart List
DecisionPoint Sector Chart List
Price Momentum Oscillator (PMO)
Swenlin Trading Oscillators (STO-B and STO-V)
DecisionPoint is not a registered investment advisor. Investment and trading decisions are solely your responsibility. DecisionPoint newsletters, blogs or website materials should NOT be interpreted as a recommendation or solicitation to buy or sell any security or to take any specific action.