
[ad_1]
S&P 500, Liquidity and Volatility Talking Points:
- The Market Perspective: S&P 500 Choppy Range Between 3,910 and 3,650
- A charge in the VIX volatility index shadowed the S&P 500’s nearly -3.0 percent drop to Thursday’s low
- While there were some fundamental sparks, the slide and ultimate pressure on the SPX’s midpoint of its October to December range is being distorted by holiday liquidity
Recommended by John Kicklighter
Building Confidence in Trading
The S&P 500 seems to be leading risk-leaning assets to defy the typical Santa Claus rally and comfortable fade in volatility that are usually ascribed to this time of year. In fact, what we are seeing may be a more direct reflection of the liquidity conditions that are typical around the holiday period. At the low of the day, the S&P 500 index dropped as much as -2.9 percent from Friday’s close to midday trade. For the emini futures contract, with its longer trading session, the peak-to-trough (from pre-exchange morning trade) was a -3.3 percent drop. Market conditions-wise, that is a significant move that seems to defy the time of year. Fundamentally, there were a few fundamental handholds for the trader that absolutely needs a reason could grab onto: headlines around China struggling to deal with a surge in Covid cases as it loosens quarantine and US leading indicator data from the Conference Board that feeds into the recently dormant recession concerns.
The technicals are probably what drew the most attention for the active trader contingent however. In the sharp decline on the day, we have a strong reversal from ‘previous support as new resistance’ around the 3,930-15 zone and more than cover what was likely considered the practical range through the close of the week. In the heat of that move, the S&P 500’s tumble pushed it through a confluence of technical levels that presented a meaningful support. For the index, the midpoint of the October to December range stands just below 3,800. In close proximity to that same level, there are the 38.2 percent Fibonacci retracement of the post-pandemic March 2020 to December 2021 bull wave and the 38.2 percent Fib of the August 16th to October 13th bear wave. There is enough overlapping density here to increase awareness and weight for a support in this area such that a break reads as more conviction than we would think likely in these markets. That said, this does not necessarily register as a break of conviction. With ramped up volatility and thinned liquidity, the ability to turn markets on a dime at technical barriers diminishes.
| Change in | Longs | Shorts | OI |
| Daily | -7% | 0% | -4% |
| Weekly | -2% | -7% | -4% |
Chart of S&P 500 Emini Futures with Volume and 100-Day SMAs (Daily)
Chart Created on Tradingview Platform
Whether there is going to be a true Thursday break or not matters less about the index close relative to the technical benchmarks. A break is a draw for most traders due to its implications for follow through. And, it will still be exceptionally difficult to override the dimming outlook for participation heading into this weekend. Holiday conditions will naturally reduce participation in the market from large shops that abide market holidays and time off for its employees. That will restrict a large segment of funds available for active turnover through these last five official trading days for the US exchanges. Looking to historical norms, the VIX volatility index typically drops through this (the 51st) week of the year and we are at present defying that norm. We will see where it ends through Friday’s close. Yet, even in historical examples of counter-trend activity from the past, the final week of the year is even more consistent in seeing the significant drain.
Chart of VIX Volatility Index and USDJPY with 20 and 60-Day Correlation (Daily)
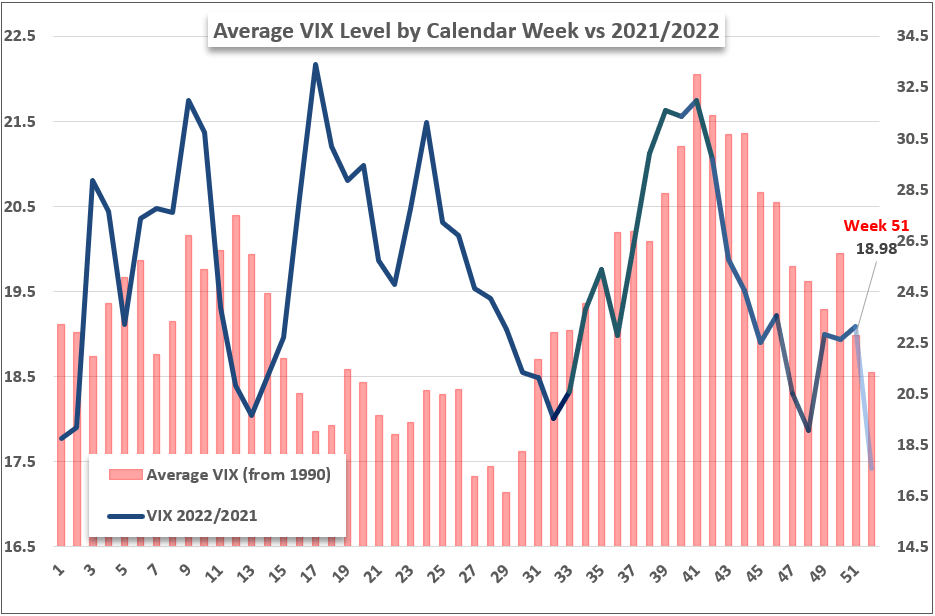
Chart Created on Tradingview Platform
On the liquidity versus volatility equation, it is still important to monitor the scheduled and unscheduled event risk ahead that could charge acute volatility that disregards technical boundaries – but that is again very unlikely to find follow through given that absolute closure of markets for the weekend. There are no crystal balls, so we can’t know what the unscheduled updates will be, though the unresolved concerns around rate speculation, recession and China’s struggles could certainly be reasonable flashpoints. As for the macroeconomic docket, only one event on the calendar stands out to me: the Fed’s favorite inflation indicator, the PCE deflator. It’s ability to tap into one of the key themes of 4Q 2022 is without question, but it will likely require a significant surprise to ignite this late into the holiday fade. An exceptional surprise to the upside would the most problematic outcome for those in risk-leaning markets. Though, that looks improbable given the trends in inflation and the change in CPI a week back.
Calendar of Macroeconomic Event Risk Through Week’s End
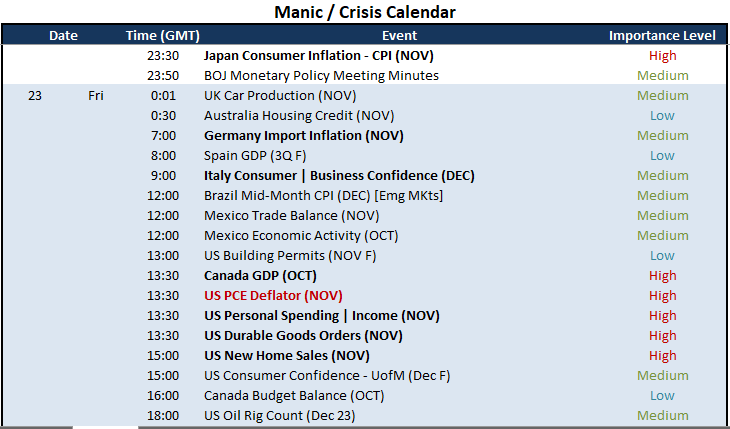
Calendar Created by John Kicklighter

[ad_2]
Image and article originally from www.dailyfx.com. Read the original article here.