
Trevor Lawrence put in a performance for the ages in the AFC Wild Card game on Saturday. Chapeaux! Lawrence started the game with four interceptions in the first half but kept on throwing and brought his team back for a big win. There are some lessons here that we can apply to trading, which can also be a mental gain.
First and foremost, the Jags and Lawrence had a game plan. The interceptions were a setback, but the Jags did not change their game plan. They kept chipping away and eventually put themselves into positive for the win.
Traders also need a strategy and cannot let a few losses derail them from that strategy. I run backtests to quantify strategies and these tests always include the consecutive number of losing trades. A mean-reversion strategy, which I introduced this past week, had a maximum of nine consecutive losses over a 15 year test. As such, I can expect to have 5-9 consecutive losses at any point in the future. I would re-evaluate the strategy should this number hit ten. Also note that the maximum number of consecutive winners was 20.
Trevor Lawrence threw four interceptions in the first half, and kept on throwing. Not only did he keep throwing, but he also kept playing with confidence, one play at a time. The Jags would have surely lost the game had he stopped throwing or started throwing in a tentative manner.
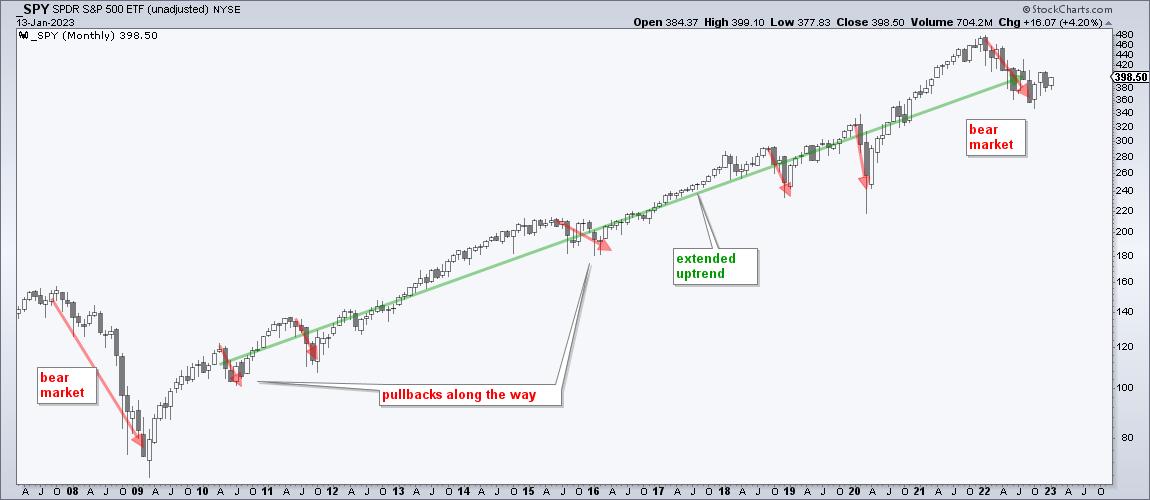
Losing trades happen and traders should continue taking signals generated by their trading strategy. Of course, the strategy should have a positive expectancy. The key is to stick with the rules and continue taking trades as they come. As with uptrends, equity curves do not go straight up. Trends (equity curves) zigzag higher with pullbacks (drawdowns) along the way. We cannot capture the winning trades or hit a winning streak if we stop trading the strategy.
Losing streaks are difficult, no doubt. A trading strategy and trading process can help traders navigate rough seas and stick with the plan.
2023 marked a move towards an even more systematic approach at TrendInvestorPro as we introduced a fully quantified mean-reversion trading strategy for ETFs. We also have a trend-momentum strategy that using the Trend Composite for signals. Click here for immediate access.
The Trend Composite, Momentum Composite, ATR Trailing Stop and eight other indicators are part of the TrendInvestorPro Indicator Edge Plugin for StockCharts ACP. Click here to learn more and take your analysis process to the next level.
—————————————