I alerted EarningsBeats.com members to the probability of short-term weakness at the start of options expiration week last Monday. There are plenty of short-term inefficiencies in the stock market and none are bigger than the manipulation around options-expiration week. It’s the primary reason why the S&P 500 has produced an annualized return of -7.79% during the 19th through 25th period of EVERY calendar month since 1950. Think about that for a second. These 7 days of the calendar month for all 12 calendar months times 72 years = 4133 trading days (days when market is open). 4133 trading days is the equivalent of 16.3 years. What would you do if I told you that the next 16 years would produce average S&P 500 losses of nearly 8% a year? Wouldn’t you want to avoid this stretch? Or maybe short it? Well, effectively that’s what we have to deal with now. The primary difference, obviously, is that it’s not 16 years of consistently-poor market behavior. But it’s EXACTLY what we deal with every calendar month, from the 19th through the 25th.
Armed with this knowledge, however, I use options-related selling as a MASSIVE advantage in entering high reward to low risk trades. They may not work out, especially if the recent market weakness accelerates, but I can define my risk per share. From there, I can determine how many shares I want to own based on the total dollars I’m willing to risk on the trade. For instance, if my downside risk is $1 per share and my maximum loss per trade is $500, then my position size might be 500 shares. I can adjust position size accordingly, if I don’t want to own the number of shares calculated.
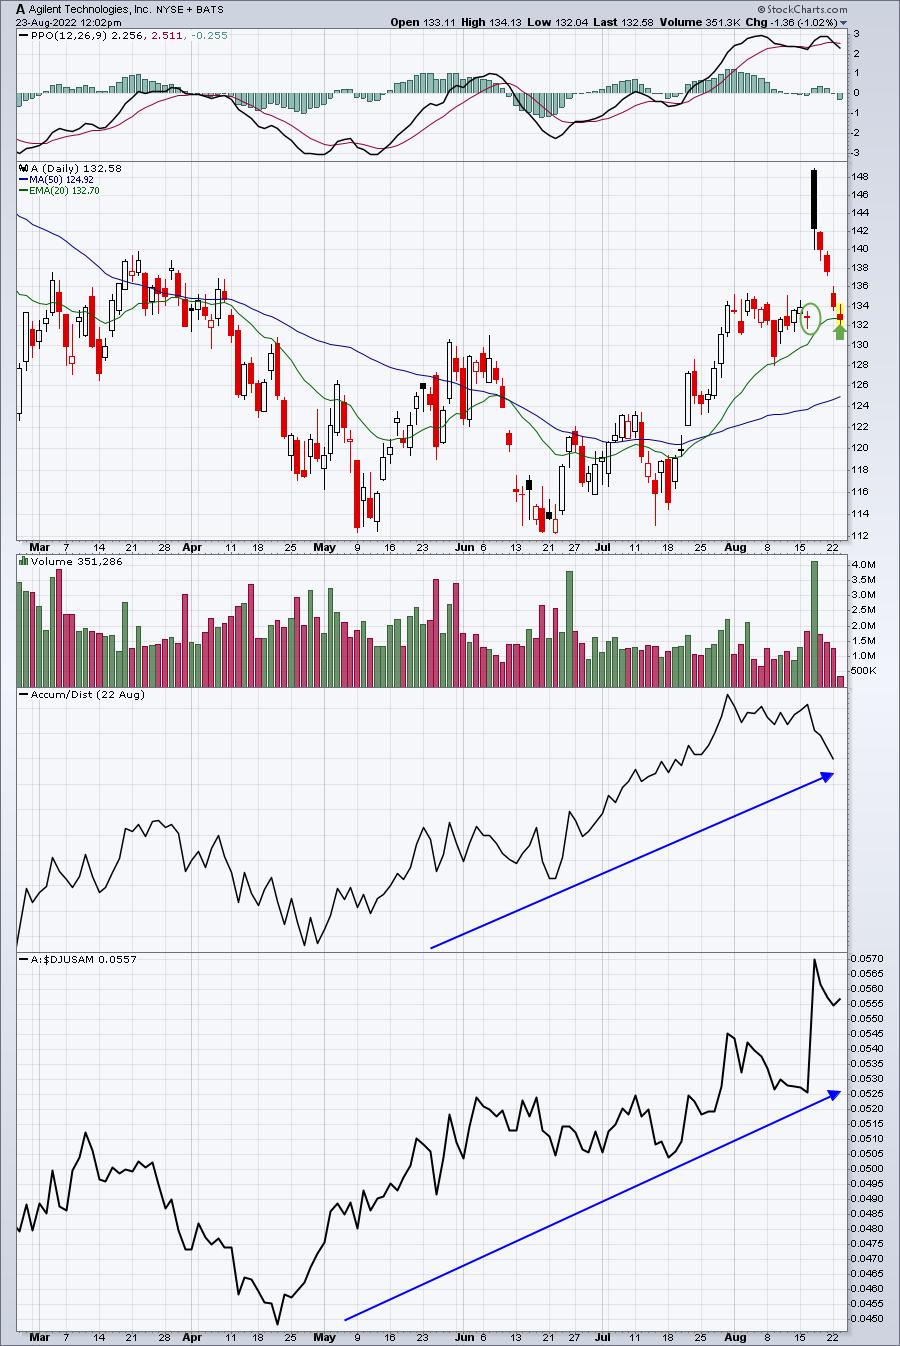
Here’s an example of a trade I just put on this morning – Agilent Technologies (A):
It’s been under apparent accumulation for the past few months and it’s been a leader among medical equipment stocks ($DJUSAM). After posting better-than-expected revenue and earnings a week ago, we added A to our Strong Earnings ChartList (SECL). When I ran a 20-day EMA scan against this ChartList this morning, A came up, along with perhaps 20 others. I looked at the chart and the above chart is what I saw. There was the huge earnings-related gap to nearly $149 and, over the past 5 options-related days, A has found its way back to test both its gap support and its 20-day EMA. If it closes beneath both, I’ll exit with most of my capital still intact. However, if this key area of technical support holds, A could be in position for a nice move back near its recent high. Again, the trade is by no means a guaranteed success, but if I can set up all of my trades in this reward to risk fashion, it won’t take many successes to easily offset the small losses that might result from those that don’t work out.
In addition to A, I just sent out 3 other Model Trades a few moments ago. If you’d like to check out all of these, you can do so by CLICKING HERE and starting a FREE 30-day trial.
Also, this Saturday, August 27th, at 10:00am ET, I’ll be hosting our biggest event in months, “Where Does The Market Go From Here?” This is a FREE virtual event. For more information, to save your seat, and join thousands of like-minded traders, click on this LINK!
I hope to see you on Saturday!
Happy trading,
Tom