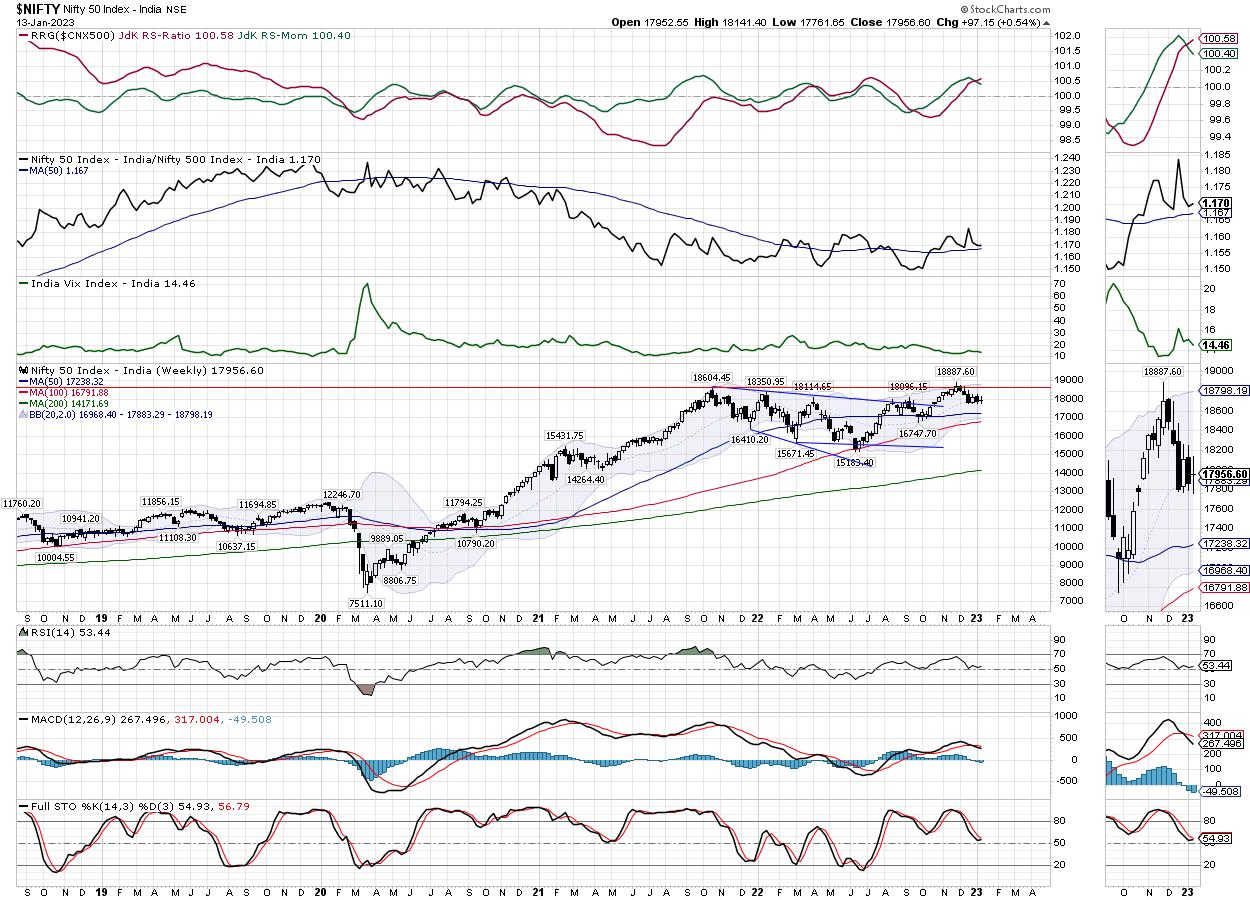
In the previous weekly technical note, it was mentioned that the markets may continue to stay in a trading range until they trade below the crucial 18300 level which is one of the major resistance points on the chart. Over the past five days, NIFTY not only remained below this point but tested crucial support levels on the daily chart multiple times. The last trading day once again saw the index rebounding from lower levels. The trading range remained modest; the index oscillated in a 379 points range throughout the week. The benchmark index finally closed with a modest gain of 97.15 points (+0.54%) on a weekly basis.
The US Markets are having a long weekend; they will be a trading holiday on Monday on account of the observance of Martin Luther King Day. From a technical perspective, this week is the fourth time that NIFTY has taken support on the shorter 20-Week MA which is currently placed at 17883. This level coincides with the 100-DMA which is in very close vicinity at 17911. This makes the zone of 17850-17900 a very important support zone for the markets on a closing basis. So long as the index trade above this zone, there are greater possibilities of the markets avoiding any major breakdown on the charts. Only a close below this zone will invite incremental weakness in the markets.
Volatility dropped again; INDIAVIX came off by 3.76% to 14.46. The coming week will see a quiet start; the levels of 18280 and 18460 acting as major resistance points. The supports will come in at 17800 and 17680 levels.
The weekly RSI stands at 53.44; it remains neutral and does not show any divergence against the price. The weekly MACD is bearish and trades below its signal line.
The pattern analysis of the weekly chart shows that the Index has continued taking support on the shorter 20-Week MA for the fourth week in a row. This level, when read along with crucial supports on the daily chart makes the zone of 17850-17900 a crucial support zone for the NIFTY.
The coming week is likely to see some risk-on approach in the markets. The US Dollar Index has stayed particularly weak; there is some room for it to get a bit weaker from here as well. This is set to auger well with the Commodities and Metal stocks. These groups, along with other economy-facing sectors are likely to do well over the coming days. A dual approach is recommended for the coming week. While shorts may be avoided so long as the NIFTY is above 17800 on a closing basis all declines must be used to pick up good quality stocks in modest quantities. While continuing to keep overall exposure controlled, a cautiously positive approach is advised for the coming week.
Sector Analysis for the coming week
In our look at Relative Rotation Graphs®, we compared various sectors against CNX500 (NIFTY 500 Index), which represents over 95% of the free float market cap of all the stocks listed
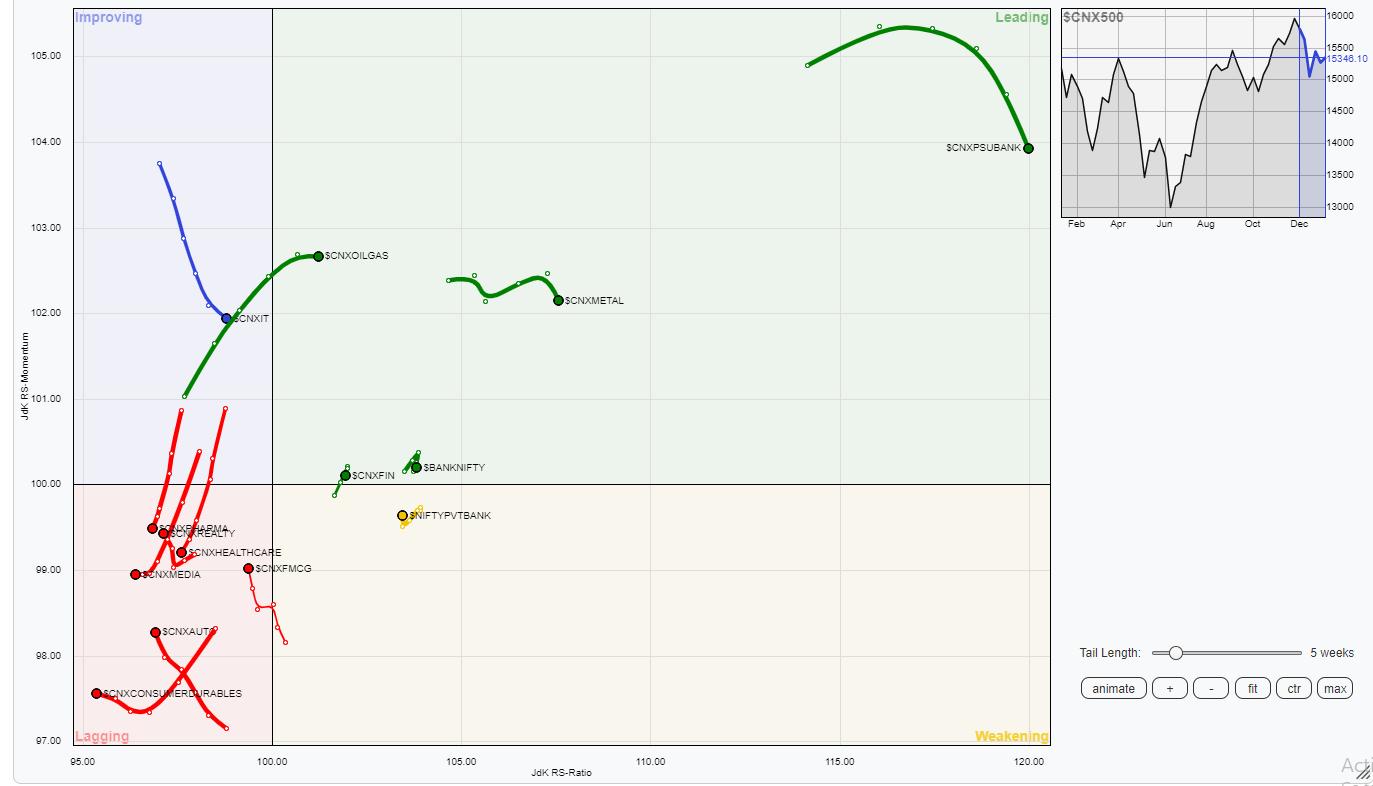
The analysis of Relative Rotation Graphs (RRG) continues to show status-quo on the sectoral setup; no major changes are seen in the way the sectors were rotating in the week before this one and the previous week. We have PSU Banks, Metals, Commodities, Infrastructure, Banknifty, Financial Services, PSE, and Services Sector Indexes inside the leading quadrant. All these groups are set to relatively outperform the broader markets.
Among these, the Financial Services Sector appears to be paring some relative momentum; we may see some consolidation creeping in this space.
Nifty Midcap, FMCG, and Auto Indexes are inside the lagging quadrant. However, they are seen improving in their relative momentum. The Pharma, Consumption, Media, and Realty groups are also inside the lagging quadrant. They are likely to relatively underperform the NIFTY500 Index.
The Energy Sector Index is inside the improving quadrant along with the IT Index. We can fairly expect these groups to put up a resilient show over the coming week.
Important Note: RRG™ charts show the relative strength and momentum for a group of stocks. In the above Chart, they show relative performance against NIFTY500 Index (Broader Markets) and should not be used directly as buy or sell signals.
Milan Vaishnav, CMT, MSTA
Consulting Technical Analyst