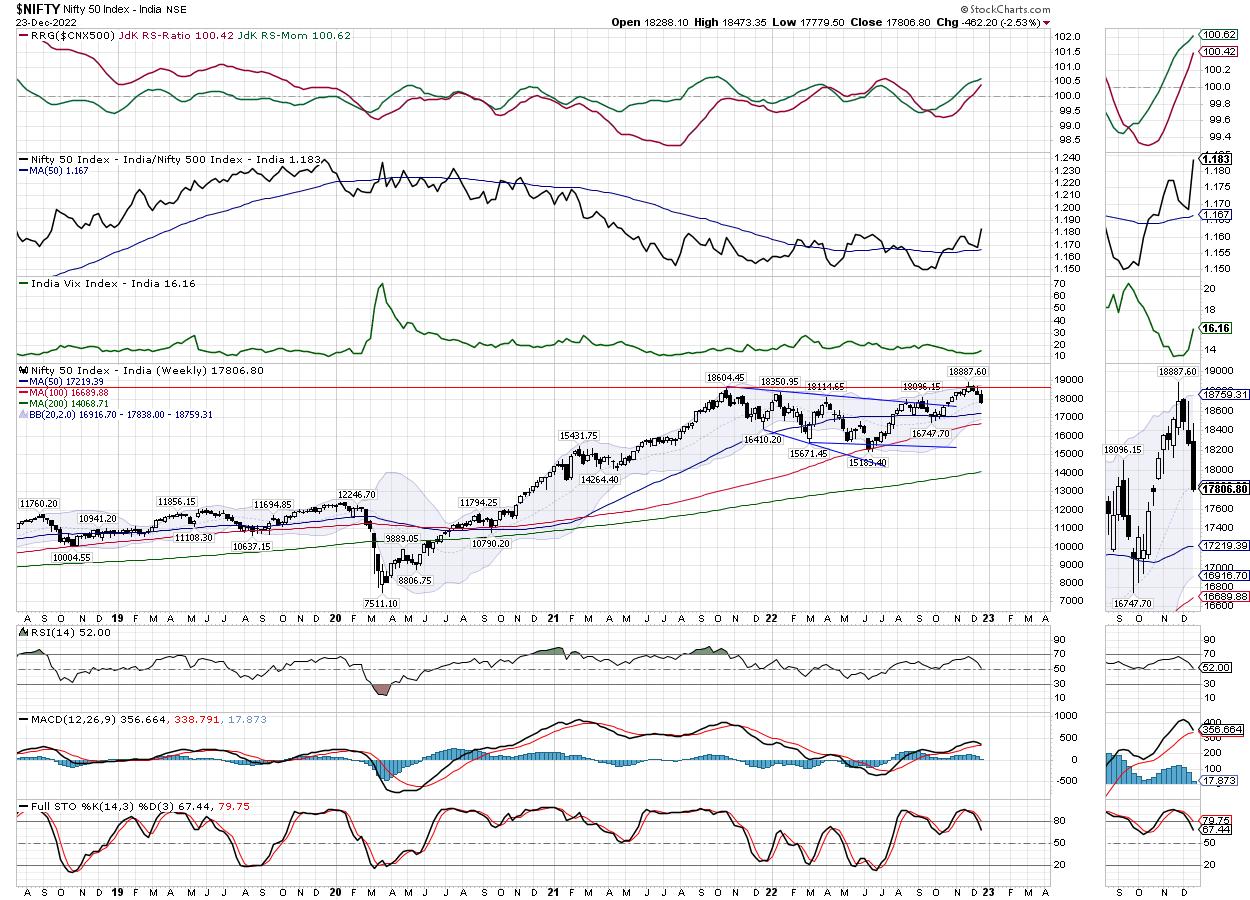
Over the past few days, the levels of 18600 on NIFTY have assumed a lot of importance as the index had staged a breakout above this point but ended up slipping below this level following a full throwback. In the previous editions of weekly technical notes, it has been mentioned quite often that any failure to stay above 18600 will not only mean a failed breakout for the markets but may also push NIFTY in some more extended corrective consolidation. The week before this one had seen NIFTY slipping below this point; the previous week saw the index extending its downside. While seeing a wider trading range of 693 points, the Index staged a corrective decline and ended with a net loss of 462.20 points (-2.53%) on a weekly basis.
The previous two weeks have been technically damaging ones; the slipping of NIFTY below 18600 levels has dragged the resistance levels lower for the Index. Now, the zone of 18400-18600 represents a very strong resistance zone for the markets going ahead from here. For any resumption of up-move to occur, moving past this zone will be required. Until this happens, NIFTY will continue to display a corrective undertone. The Index has closed a notch below the shorter 20-week MA which currently stands at 17838. If this is not defended on a weekly closing basis, this may lead to some incremental weakness. If this point is defended, this may keep markets under prolonged consolidation.
Volatility spiked as INDIAVIX surged 14.85% to 16.16 on a weekly basis. The global markets have shown some respite from the downside; this may help our markets to begin the week on a relatively stable note. The coming week is expected to see levels of 17930 and 18220 acting as potential resistance points. The supports come in at 17710 and 17580 levels.
The weekly RSI is 52; it is neutral and does not show any divergence against the price. The weekly MACD is bullish and remains above the signal line. However, the narrowing slope of the Histogram shows that this indicator may show a negative crossover in the coming days.
The pattern analysis of the chart shows that the NIFTY attempted a breakout by moving past the previous lifetime high point of 18604; however, after testing 18887 levels, the index not only retested the breakout point of 18600 but also significantly slipped below that level as well. As of now, the attempted breakout has failed and NIFTY continues to face strong resistance at 18600 levels.
The holiday season is likely to keep overall volumes at lower levels; this may likely keep the overall markets within a defined range. There are strong possibilities of a technical pullback given the kind of one-way decline that we have witnessed. This being said, the action will continue to remain highly stock-specific in nature. We may see the defensive pockets doing well but the renewed-covid fears may well keep the markets a bit tentative over the coming days. It is strongly recommended that leveraged positions must be kept at modest levels and profits on either side of the move must be vigilantly protected. A cautious outlook is advised for the week.
Sector Analysis for the coming week
In our look at Relative Rotation Graphs®, we compared various sectors against CNX500 (NIFTY 500 Index), which represents over 95% of the free float market cap of all the stocks listed
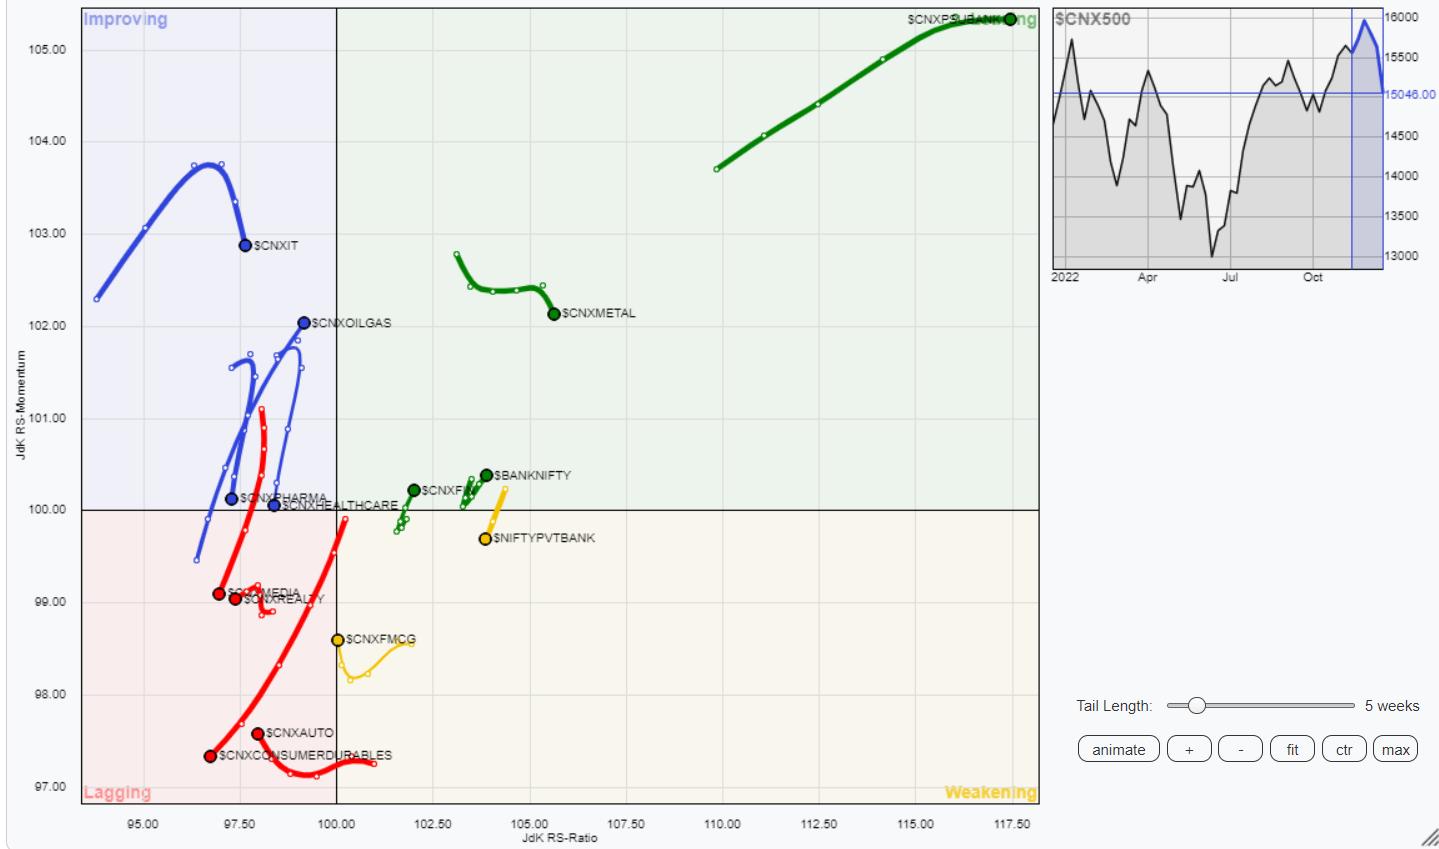
The analysis of Relative Rotation Graphs (RRG) shows the PSE Sector Index has rolled inside the leading quadrant. This index, along with Metal, Nifty Bank, PSU Bank, Infrastructure, Commodities, and Financial Services index that are inside the leading quadrant, is likely to relatively outperform the broader NIFTY500 Index.
The FMCG index continues to remain in the weakening quadrant.
The Midcap 100 index has rolled inside the lagging quadrant. Besides this index, Nifty Consumption, Auto, Realty, and Media indices are also seen languishing inside the lagging quadrant.
The Energy Index has rolled inside the improving quadrant and may show stock-specific outperformance along with the IT index which is also inside the improving quadrant. The NIFTY Pharma index is also inside the improving quadrant but it appears to be sharply giving up on its relative momentum.
Important Note: RRG™ charts show the relative strength and momentum for a group of stocks. In the above Chart, they show relative performance against NIFTY500 Index (Broader Markets) and should not be used directly as buy or sell signals.
Milan Vaishnav, CMT, MSTA
Consulting Technical Analyst