

[ad_1]
Gold, XAU/USD, Bond Yields, Hang Seng, ISM Data, Technical Analysis – Briefing:
- Gold prices roared higher to start off trading in the new year
- Treasury yields falling amid Apple production woes helped
- XAU/USD eyeing ISM data after Asia-Pacific trade optimism
Recommended by Daniel Dubrovsky
Get Your Free Gold Forecast
Gold prices aimed higher over the past 24 hours as financial markets settled into the new year. The anti-fiat yellow metal inversely tracked the 10-year Treasury yield. The latter fell 2.3 percent in the worst single day drop since the middle of December.
The drop in bond rates matters for the non-yielding precious metal. Last year, XAU/USD suffered as aggressive monetary tightening pushed up bond yields and the US Dollar. That dampened the prospect of holding gold. It also remains a key risk for the yellow metal this year.
A closer look at the past 24 hours shows that losses in tech stocks helped drive pessimism on Wall Street. Most notably, Apple’s stock sank 3.74%, bringing the company’s total valuation below USD 2 trillion. The firm announced that it is planning on a reduction in iPhone production plans in the coming months.
That is a sign of increasing concerns about global growth, which understandably cooled longer-term Treasury yields, propelling XAU/USD.
Meanwhile, investors increasingly turned optimistic about China as the Hang Seng Index soared during Wednesday’s Asia-Pacific trading session. According to Bloomberg, Chinese regulators approved a USD 1.5 billion plan by Ant Group to raise capital. The Chinese Yuan also rallied at the cost of the US Dollar. Gold capitalized on this move as US bond yields continued lower during the APAC session.
Ahead, XAU/USD is eyeing US ISM manufacturing data. A further slowdown to 48.5 from 49 is expected in December. Values below 50 indicate increasingly contracting economic activity. A softer-than-expected outcome could further cool bond yields, boosting gold.
Gold Gains in Asia as Treasury Yields Sink and Hang Seng Index Rallies
Gold Technical Analysis
Gold continues to trade higher within the boundaries of a brewing Rising Wedge chart formation. While the pattern itself is bearish, prices may continue higher within the boundaries of the wedge. A breakout higher would likely offer an increasingly bullish bias. Otherwise, a breakout under would open the door to perhaps revisiting the 50-day Simple Moving Average.
Negative RSI divergence shows that upside momentum is fading. This is a sign of fading upside momentum, which can at times precede a turn lower.
Recommended by Daniel Dubrovsky
How to Trade Gold
XAU/USD Daily Chart
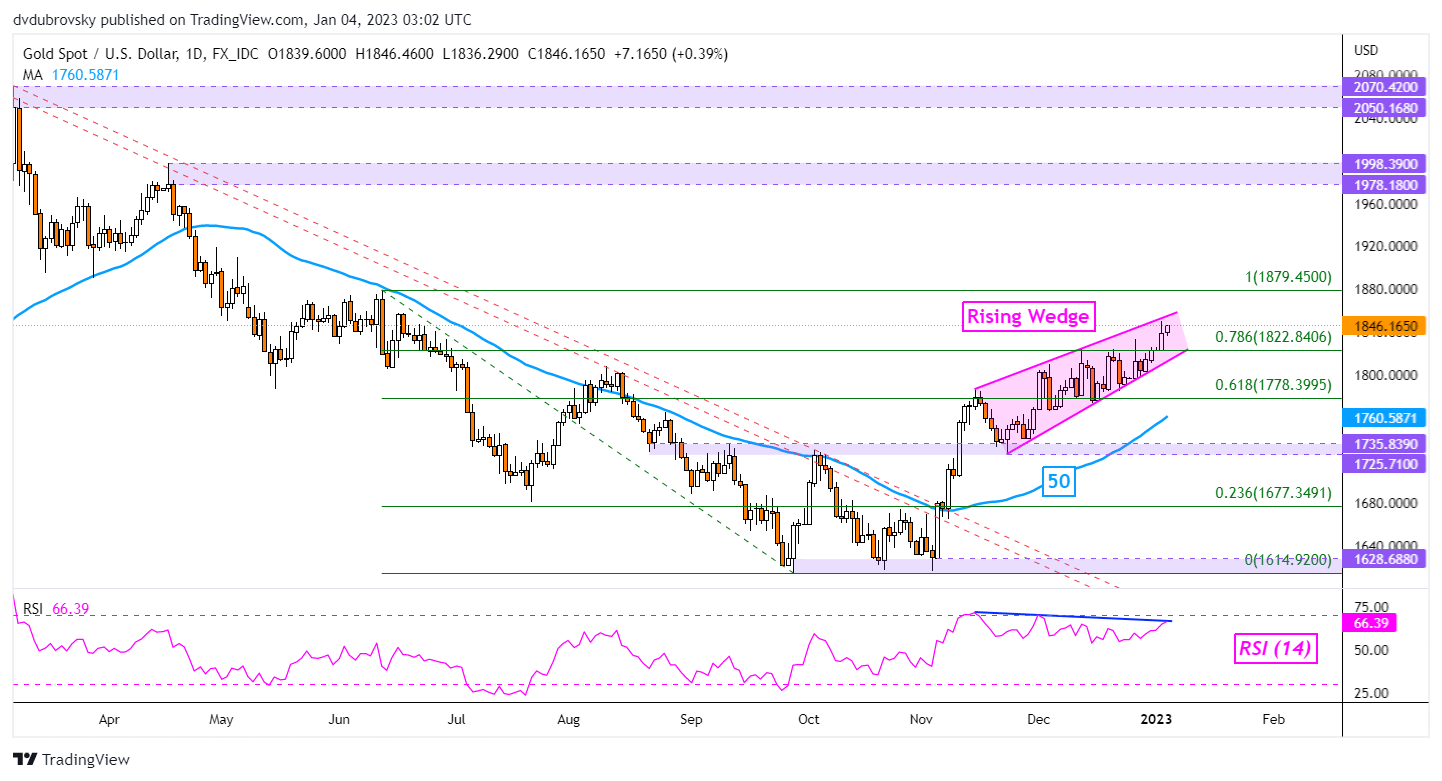
Chart Created Using TradingView
— Written by Daniel Dubrovsky, Senior Strategist for DailyFX.com
To contact Daniel, follow him on Twitter:@ddubrovskyFX
[ad_2]
Image and article originally from www.dailyfx.com. Read the original article here.