
[ad_1]
I received emails about the 4-Phase Framework:
- Did I not send out invitations for the public presentation?
- Can you give an example of a “soft stop”?
INVITATION
My apologies for the misunderstanding. The invitations to my list will be going out today and tomorrow. I mentioned in the post “Solution to a Burnt Trading Hand” that I had been running some beta programs. These are the invitation-only programs where I test my content to ensure that it will deliver on my objectives.
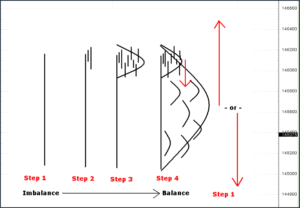
EXAMPLE of ‘SOFT STOP’
An opportune request.
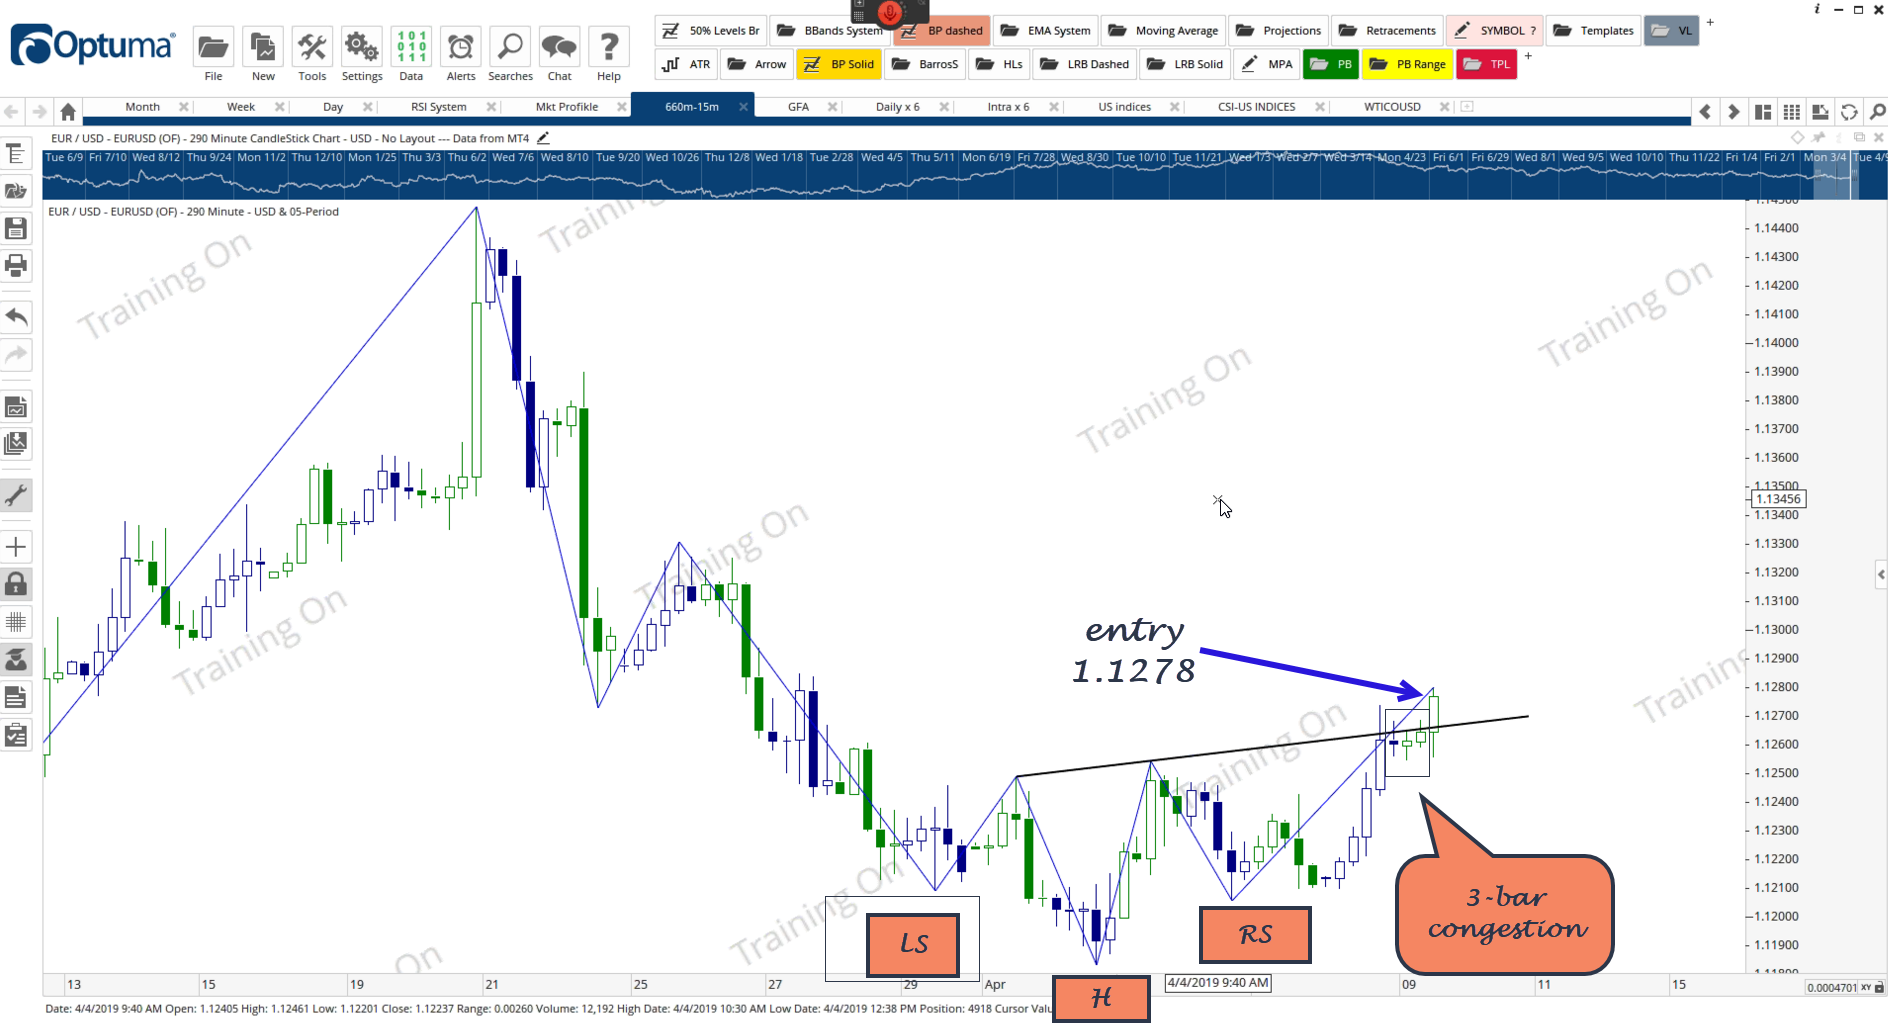
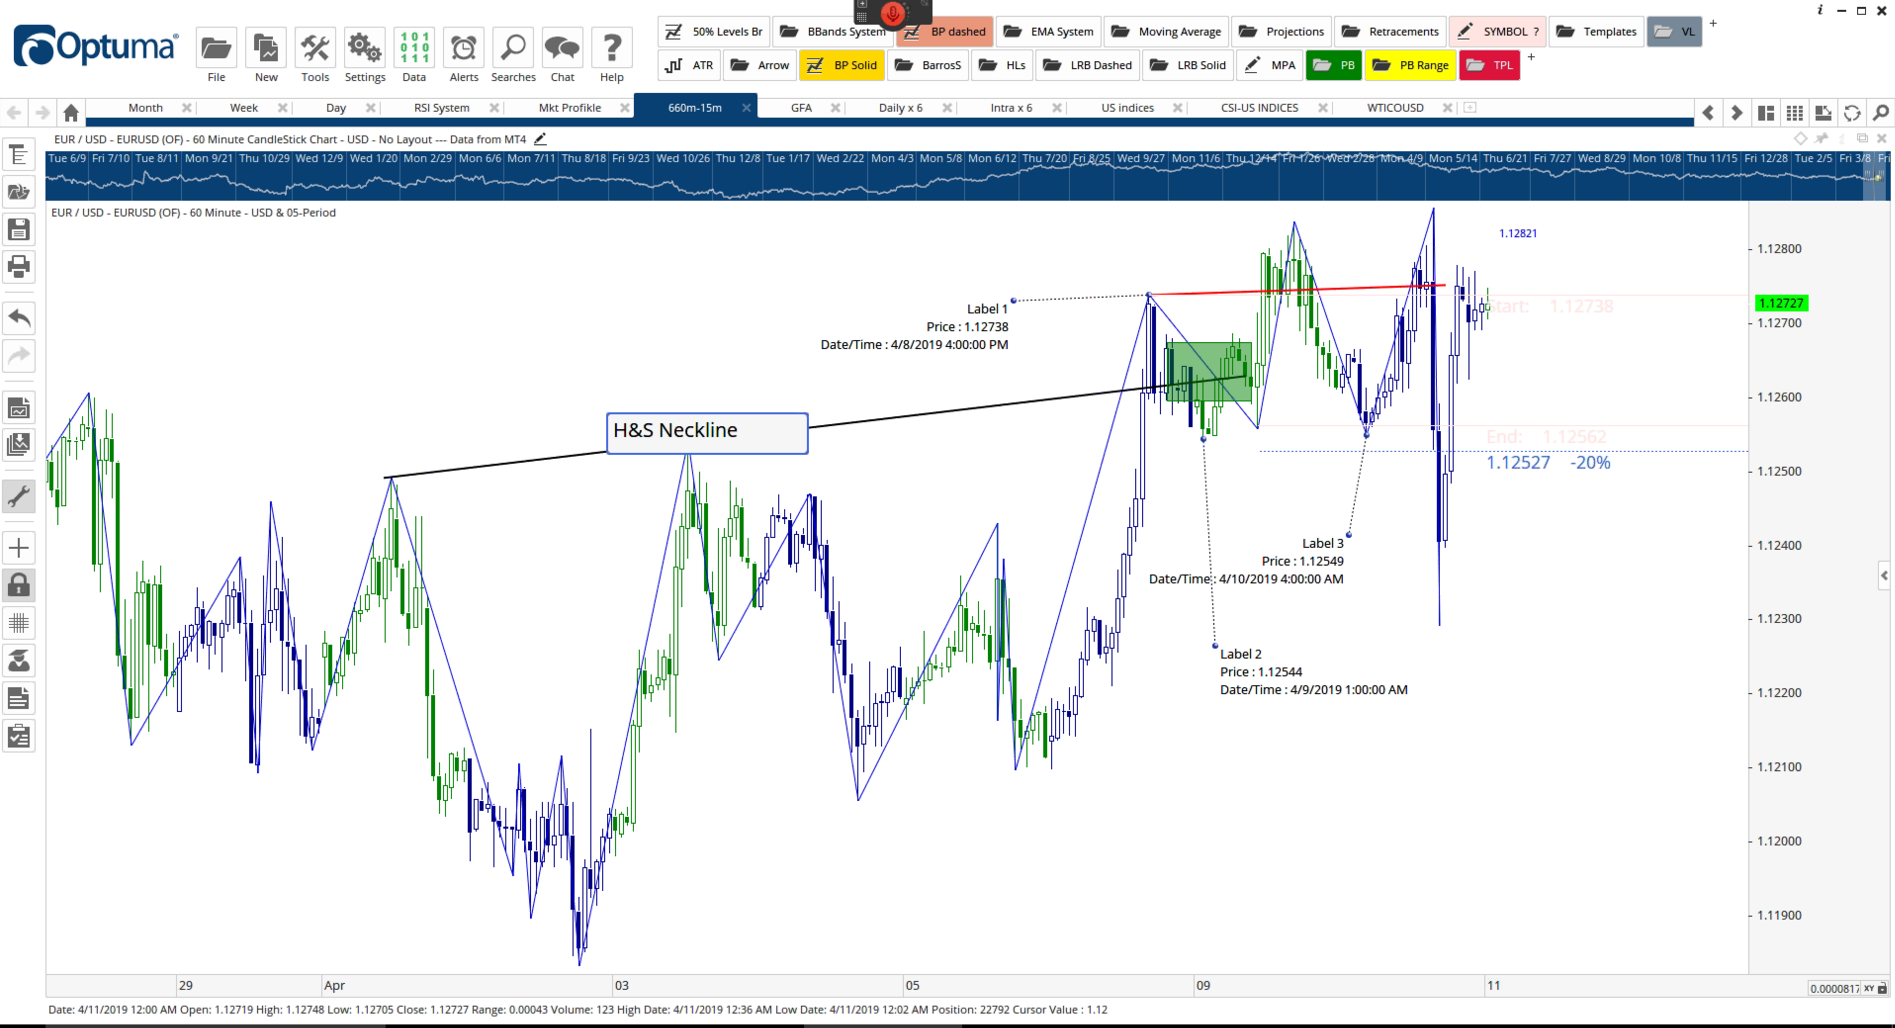
Here is a trade that I exited last night. The chart below shows the entry and the two setups I relied on:
- The Head and Shoulders, and
- The 3-Bar Congestion.
I took the trade on a 60-minute bar and was filled at 1.1278.
The “soft stop” for a 3-Bar Congestion is: prices should not return to its price zone. The chart below is a 60-minute. The rectangle marks what I consider the “critical return zone”. My ‘hard stops’ stops were placed below 1.1252.
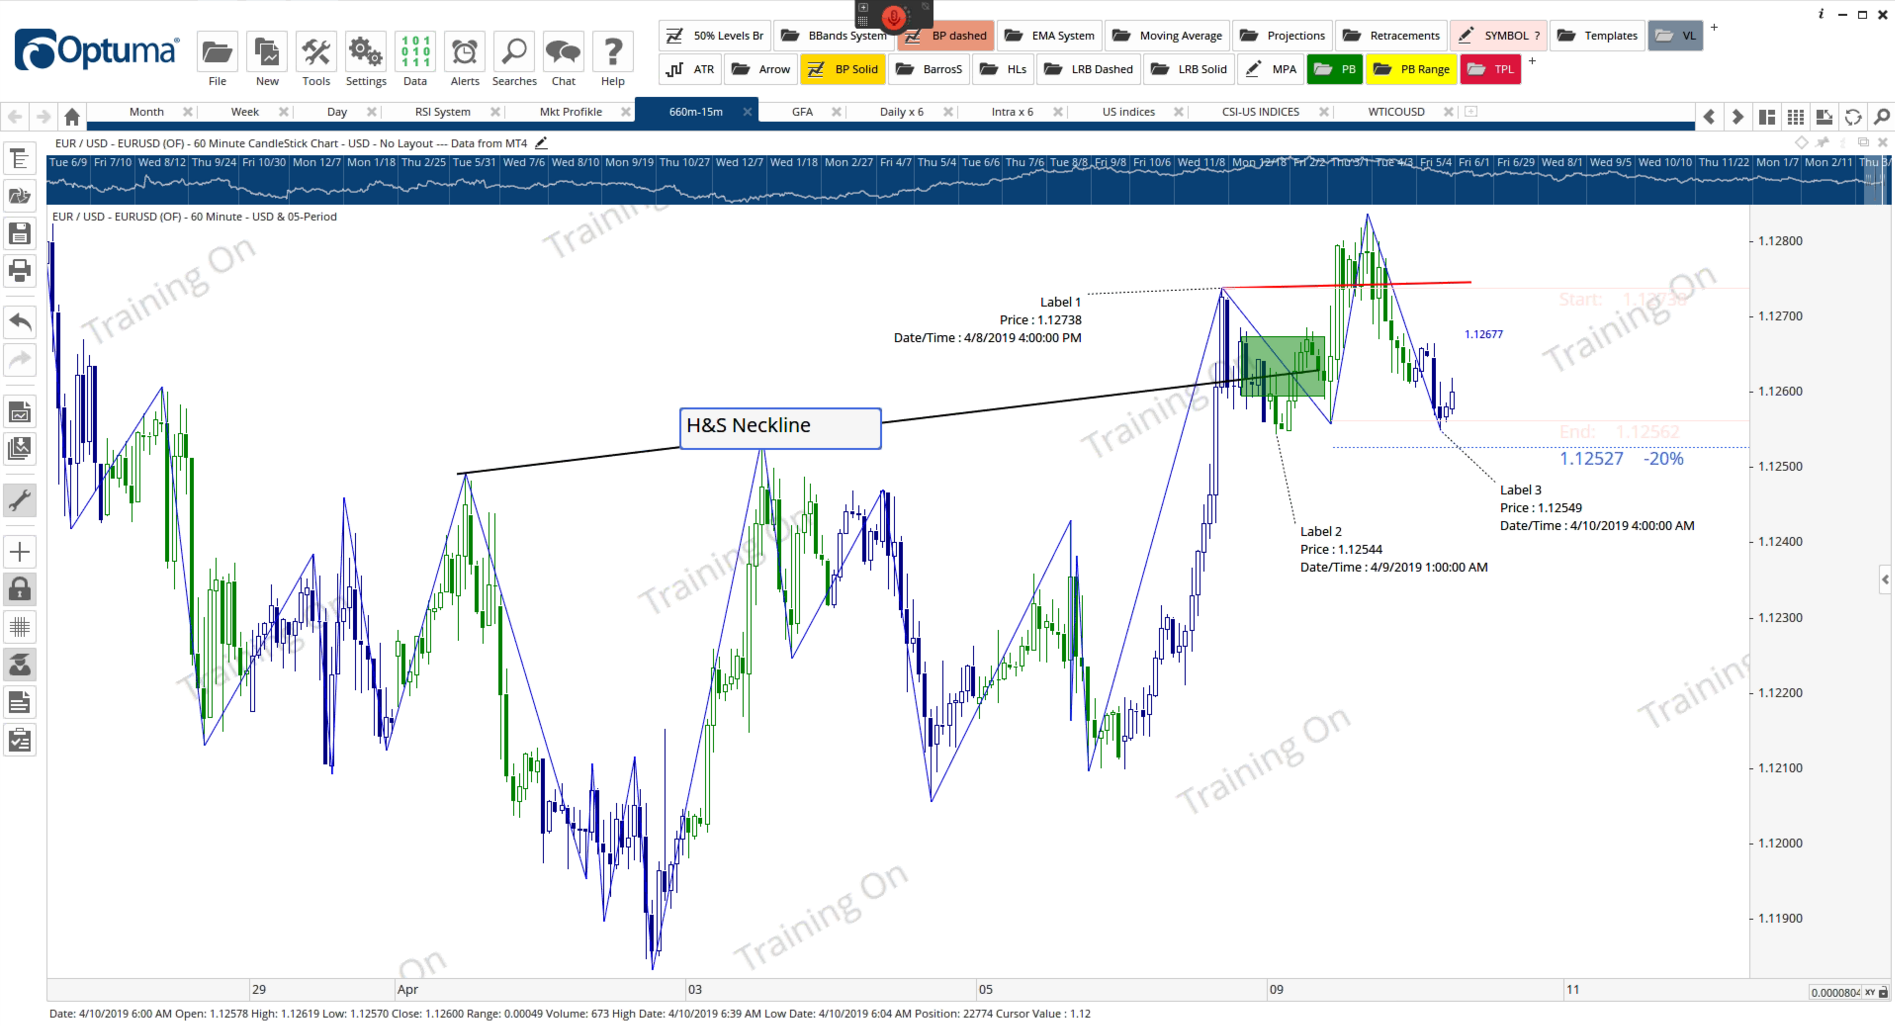
The “soft stop” conditions were elected. The question now was, where would I exit? My hardwiring said at the “entry point”. But, the market doesn’t care where I entered; it will do what it will do. So, the ‘soft’ exit needed to be determined.
Looking at the chart, I decided that, assuming I was not stopped out, there were three possibilities:
- The pair was forming a head and shoulders pattern. In that case, I could look to close out at around 1.1273.
- The pair would form a congestion pattern between the high and 1.1254. An exit around the Primary Rejection Zone.
- The pair would move to new highs.
The most conservative estimate was a return to 1.1273. So, that’s where I decided to exit. The actual price I decided upon was 1.1272.
The chart below shows what happened.
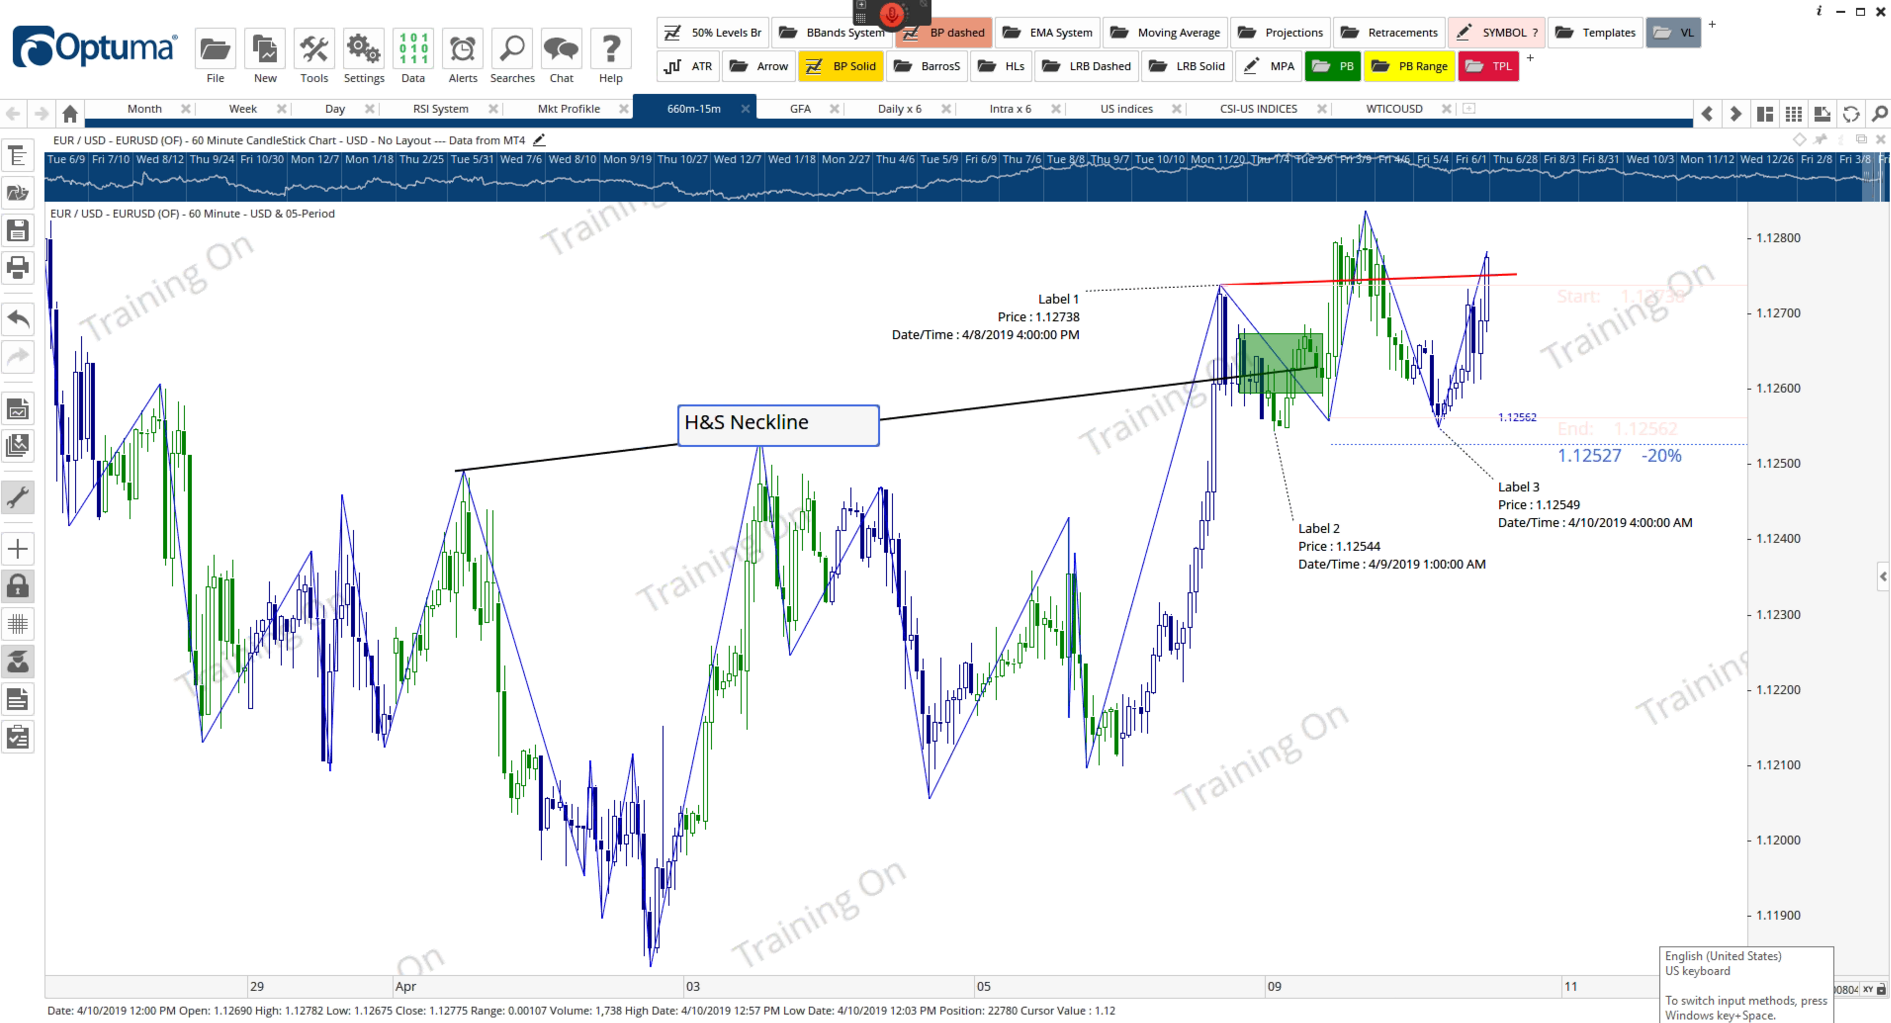
That’s an example of a ‘soft stop’. Note that each set up in the 4-Phase Framework has its “soft stops”.
Of course, I was risking the break to new highs. In that event, I’d re-enter the trade. The important factor was rather than losing 30 or more pips, I kept the loss down to 7.
And yes, with the benefit of hindsight, I could have broken even. But imagine how I would have felt if the pair had gone to 1.1272 and then stopped me out?
The chart below shows the price action after the EU rate decision and FOMC minutes. (And no, I did not take part. Finally, yes, the trade is in the Psyquation account).
[ad_2]
Image and article originally from www.tradingsuccess.com. Read the original article here.