[ad_1]
Pgiam/iStock via Getty Images
The Master Sentiment Indicator – MSI
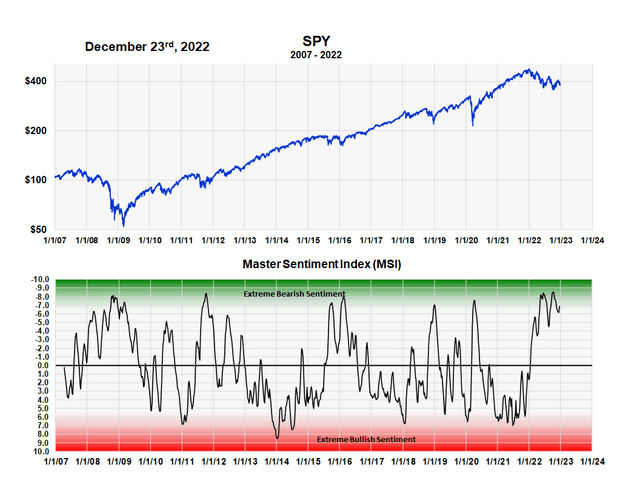
The master sentiment indicator, which is the first graph shown below, is a composite indicator made by combining nine, well established sentiment indicators. The nine indicators that make up the composite are listed below the graph. The MSI is fully explained in this earlier article (here).
The concept behind the MSI is that any one sentiment indicator might not work well in a particular market but by combining multiple indicators into one, you get more reliable and self-confirming results. The current MSI reading of -6.9 is still relatively bearish after the two month rally off the October low.
The MSI is designed to measure investor expectations over the long term; it is not a short-term indicator looking for daily or weekly moves. It’s intended to signal bull and bear markets or significant intermediate term moves. The scale on the left, which goes from plus 10 to minus 10, is the Sentiment King ranking scale and is fully explained in this article (here). The SK ranking system provides the methodology that allows us to combine different types of indicators on the same scale.
The green area in the graph indicates extreme degrees of bearish sentiment while the red area represents shades of extreme bullish sentiment. It’s plotted against the S&P 500 SPIDER ETF SPY from 2007 to present to show the ability of the MSI to signal major market lows.
Master Sentiment Indicator plotted against the SPY (Michael McDonald)
The Nine Indicators That Make Up The MSI
The nine sentiment indicators that combine to make up the Master Sentiment Indicator are listed here:
- 5% CBOE Total Puts and Calls Ratio
- 5% CBOE Equity Puts to Calls Ratio
- The CME Commitment of Traders data on the S&P futures
- Buying in the ProShares S&P 500 Inverse Fund (SH)
- NAAIM Exposure Index (National Association of Active Managers)
- Hulbert Rating Service (Stocks)
- Hulbert Rating Service (Nasdaq)
- The AAII Sentiment Survey
- Investor’s Intelligence
This article focuses on the two Hulbert Rating Surveys shown in bold print.
The Hulbert Rating Surveys
Essentially the Hulbert Rating Service monitors the market expectations of newsletter writers. They’ve been doing it for over forty years. The following is taken from Mark Hulbert’s website (hulbertratings):
The Hulbert Financial Digest was founded in 1980 by Mark Hulbert with the goal of tracking investment advisory newsletters. Ever since it has been the premiere source of objective and independent performance ratings for the industry. The Hulbert Financial Digest was acquired by CBS MarketWatch in 2002; that firm was in turn acquired by Dow Jones in 2005 and renamed MarketWatch.
One of the most distinct patterns that Mr. Hulbert soon noticed in his newsletter monitoring was the inverse correlation between the markets and the consensus opinions of monitored newsletters: They tended to be most bullish at or near market tops and most bearish at or near bottoms. This led him in the 1990s to create his now-famous Hulbert Sentiment Indices, and they have been updated on a daily basis ever since. In addition, he has retroactively calculated those indices’ daily values back to 1985. Those historical values are made available to paid subscribers.
He monitors newsletter writers on a daily basis. Hulbert separates newsletter writers into those who follow speculative NASDAQ stocks and those who follow all stocks. Because of this he publishes two distinct surveys.
At the Sentiment King, we take his daily data, apply a time weighted moving average to it to give it a longer-term slant, and then put that on the Sentiment King ranking scale. So, what you see here is our interpretation of his basic data.
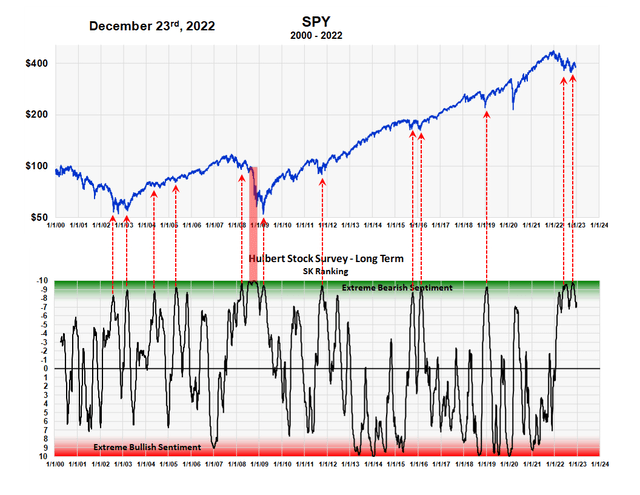
The first chart is our interpretation of his newsletter writer’s data for the entire stock market. It’s graphed from 2000 to present against the SPY. We’ve indicated on the graph using red arrows high points of bearish sentiment. It definitely gave an early signal in 2007-08 (shown by the large red band) but in general it has been pretty successful at indicating important stock market lows over the last twenty-two years. This relative success is the reason we include it as one of the nine indicators in our MSI.
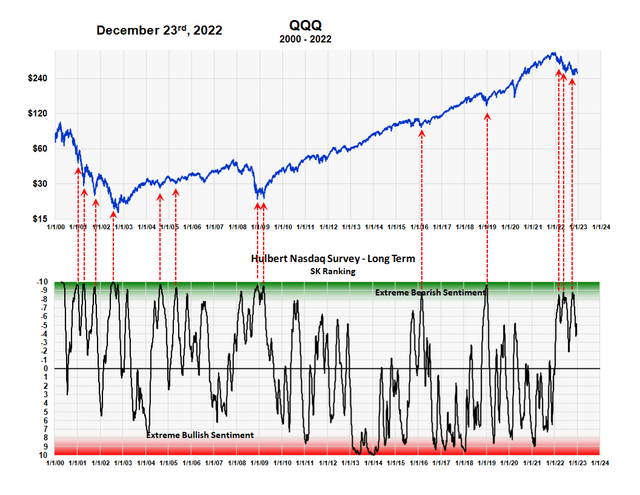
The second graph below plots newsletter writers’ expectations for NASDAQ stocks against QQQ. In our opinion it’s not quite as successful as the stock survey but it’s successful enough to warrant a position as one of the nine indicators in the MSI. These charts also highlight why is it important not to focus on anyone sentiment indicator but to combine them into a composite like we do with the MSI.
Sentiment King Ranking of Hulbert newsletter data (Michael McDonald) Sentiment King Ranking of Hulbert Nasdaq Newsletter Writer Survey (Michael McDonald)

Takeaway
We feel that’s the relatively high level of bearish sentiment shown by both the Master Sentiment Indicator and our interpretation of the two Hulbert Newsletter writer surveys point to higher stock prices.
[ad_2]
Image and article originally from seekingalpha.com. Read the original article here.
