
The market is a relentlessly evolving ecosystem that bubbles up and retreats in different areas of the market at any given time. It is very important to be aware of when the trend changes under the surface. I have been cautious through December, as my calculations suggested avoiding the market.
The small pockets of success in October and November have been overrun by the selling, creating a down move on the indexes. When the markets turn higher, I like to be ready. This particular week has thin trading volumes, but it is also interesting that some of my calculations are starting to improve.
We look at the charts and data every day, so, as the market changes, we can react. If I was bearish last week, it was because the data continued to suggest that. Only the market is right, and our plan is to be involved when the market information changes. I will change with the data.
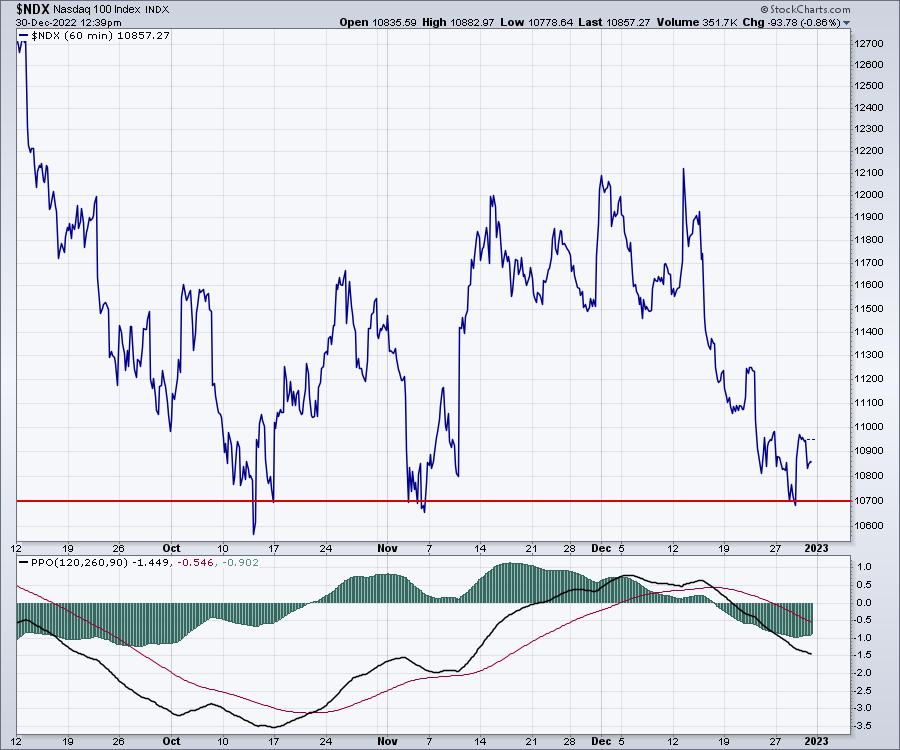
The Nasdaq stock market is hanging by fingernails at the lows from October and November. It is easy to see on a 60-minute line chart.
One of the things I am starting to notice is that a few of the tech names are more resilient at this juncture than they were at prior lows by the index.
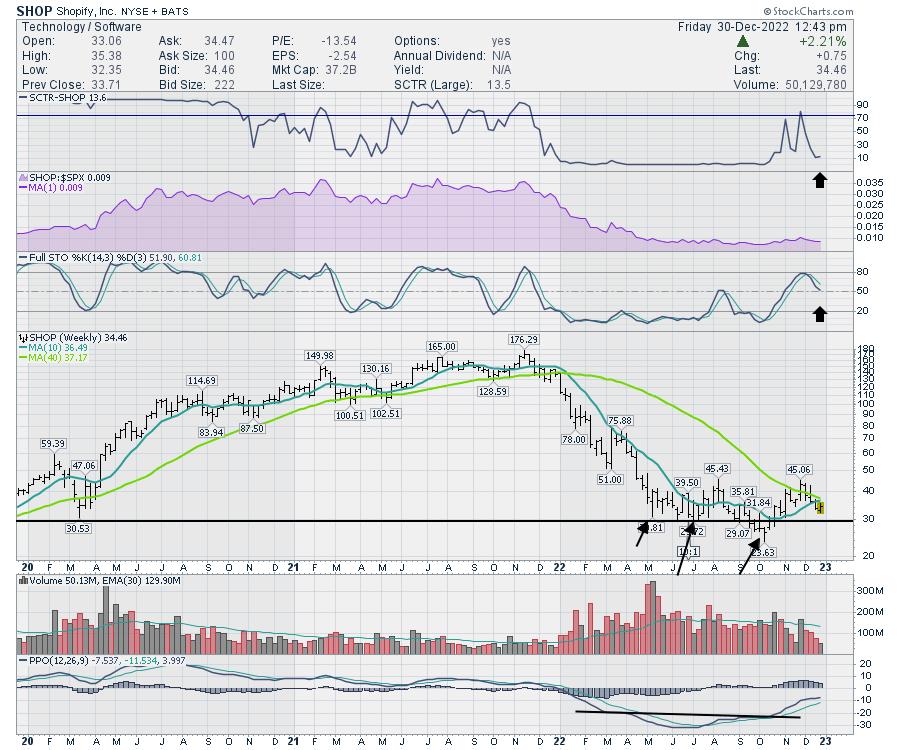
Here’s an example. Shopify (SHOP) was a stock market darling as it exploded higher in 2020 and 2021. 2022 has been a different story. Here are a few things to note:
- The SCTR ranking is starting to kick up for the first time in a while.
- The full stochastic surge looks like a change in trend, as it went to the top of the range and is now pulling back to the 50% level.
- The stock price has built an eight-month base with three drives to a low. Now the stock is holding above the prior lows, while the Nasdaq index is all the way down to the lowest levels.
- Volume has been declining on this December selloff, rather than expanding like it did on the way down.
- The percentage price oscillator (PPO) momentum indicator is making a higher push and appears to have built a base as well. As it pauses here, can it turn and go higher?
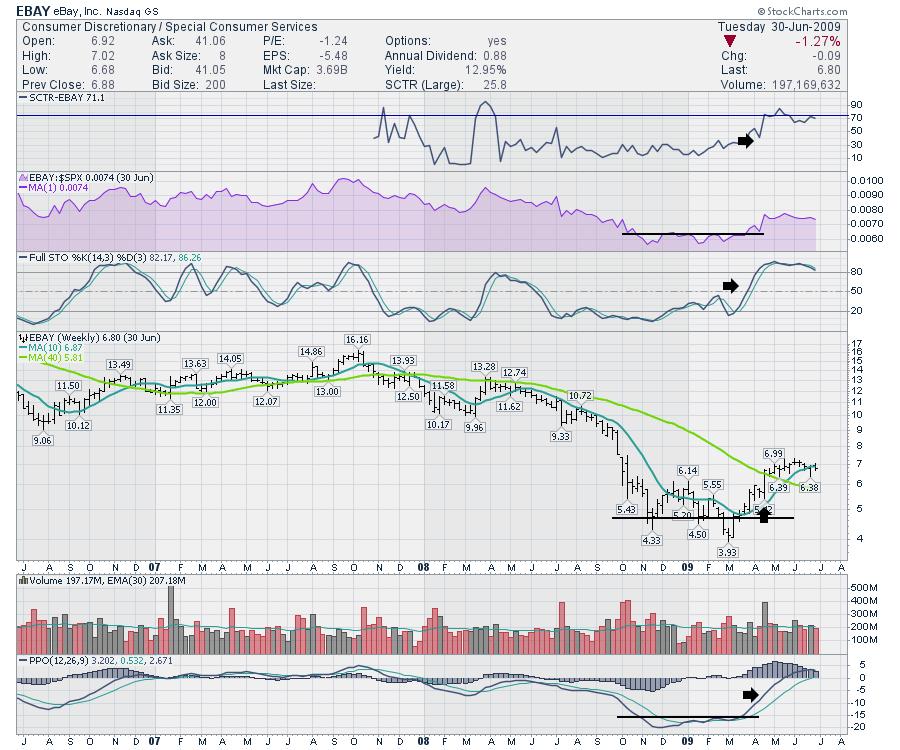
EBAY: A Strong Retailer in 2008–2009
Let me take you to another historical stock pattern that was a former leader and built an important base back at the 2009 low before expanding to the upside. This type of price action is also a Wyckoff base structure that Bruce Fraser talks about. This basing pattern shows how the shareholders are no longer willing to sell, and anyone who has sold ran out of patience. The six-month period really exhausts the sellers.
EBAY topped along with the S&P 500 index ($SPX) in October 2007. It sold off 80% before bottoming. Check out some of the indicator signals and how similar they are to the current setup in SHOP.
To me, they look similar and my underlying market condition charts are trying to improve. This surprises me as I expect 2023 to be a mess of a year. However, when a rally starts, I want to be ready. What if it ends up being the major low?
2023 Outlook
It always looks darkest before dawn. My end-of-year reviews on the Market Buzz show covering retail and commercial business look bleak. None of us know what next year will bring, but it’s important to be ready for whatever comes. Rarely will the market low be obvious. If you participate in all of them, we can be sure to be invested as the market accelerates higher. However, you must also be diligent in protecting our capital in case the rally collapses.
As an example, if you thought being in the market at the October lows was timely, and exiting in November before the market fell was helpful, then you might enjoy our content. Now that the Nasdaq has retested the prior low, maybe we can rally from here?
That’s the type of information we provide to clients at Osprey Strategic. As the market conditions continue to improve, I’ll be putting my money to work, regardless of my long-term view. Pretty sure my buying won’t change the trend, but SHOP has what I like to see on a chart. The chart is the reason I am interested here, but, if the broader market can improve, this is where big gains can be made as a rising tide lifts all boats. Once again.
I’ll also be hosting an information session January 10th at 11 ET about the work we do at Osprey Strategic.
Our focus is protecting capital and deploying it at critical times to make the most of the gains. If you’d like to see what we do, there is a $7 offer for the first month on the home page.