[ad_1]
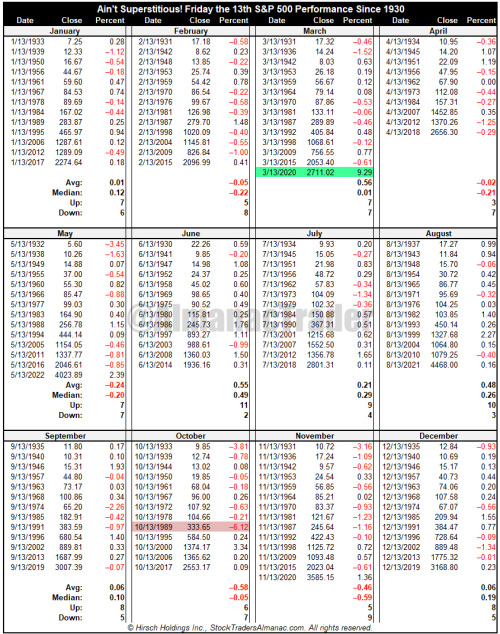
Since 1930, the S&P 500 has traded a grand total of 156 Friday 13th across all twelve months. The overall track record is 86 up days and 70 down days with a modestly bullish average gain of 0.04% on all Friday 13ths.
The worst Friday 13th loss was 6.12% in October 1989. This day is often referred to as “Black Friday.” The best Friday 13th gain was 9.29% in March 2020. Digging deeper into the data reveals that January Friday 13th has been up 7 times, down 6 times with an average gain of 0.01%.
Whether or not recent market gains will hold and continue, turning our January Barometer and our Trifecta positive and confirming our bullish outlook for 2023, will likely have little to do with superstition.
[ad_2]
Image and article originally from jeffhirsch.tumblr.com. Read the original article here.


