
[ad_1]
Unfortunately, the stock market is delivering on its bearish
historical 4-Year Cycle and seasonal tendencies here at the midway point of
2022. It is also playing out the less than sanguine outlook we wrote last year
around this time in the 2022 Stock Trader’s Almanac (pages
10-11) and in our annual
forecast from last December 16. So where do we go from here?
Much to our chagrin the short answer is that we have likely not
seen the low either in price or time. Current trends are now leaning towards
the “Worst Case” scenario we presented in our 2022 forecast which was for a
“Mild bear market for S&P 500 with 2022 ending down 10-20%.” With S&P
500 down 20.6% year-to-date at the end of June the bear is fully in
place.
As we have been guiding over the past several months, we still
expect this bear to put in a typical midterm election year bottom sometime in
the August-October timeframe just ahead of the midterm elections. Stocks are
clearly exhibiting the historical weakness that often transpires in the Worst
Six Months of the year May-October and they are also tracking the “Weak Spot”
of the 4-year cycle. But this should set us up for the “Sweet Spot” of the
cycle from Q4 midterm year through Q2 pre-election year.
The intersection of the annual seasonal pattern and the 4-Year
Cycle produces the quadrennial “Sweet Spot.” As we continue to patiently ride
out this bear the chart below of the 4-year cycle may provide some solace. We
are currently finalizing the 2023 edition of the Stock
Trader’s Almanac so here’s a sneak peek at this new chart from
the 2023 STA that highlights the midterm low and most importantly the
quadrennial rally from the midterm low to the pre-election year high in what we
call the Sweet Spot of the 4-year cycle.
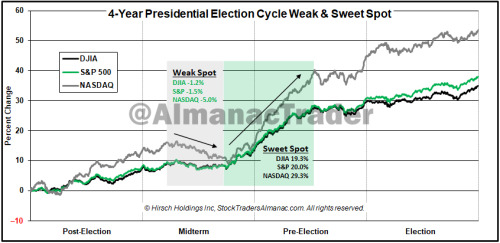
The second and third quarter of the midterm year has been the
weakest period of the entire 4-year pattern averaging losses over the 2-quarter
period of -1.2% for the Dow, -1.5% for the S&P 500 and -5.0% for the NASDAQ
Composite Index. But in the Sweet Spot of the cycle the Dow gains 19.3%,
S&P 500 increases 20.0% and NASDAQ jumps 29.3% over the three-quarter span
from midterm year Q4 to pre-election year Q2.
It is for this reason that we call midterm election years “A
Bottom Pickers Paradise.” From the midterm low to the pre-election year high
DJIA gains 46.8% since 1914 and NASDAQ gains a whopping 68.2% since 1974! As
the 2022 bear market runs its course, the market will likely bounce along
sideways, testing the lows, hitting its low point in late Q3 or early Q4 in the
August-October period in prototypical midterm bottom fashion. Then be prepared
for the rally off that low into the Sweet Spot and beyond to new highs.
[ad_2]
Image and article originally from jeffhirsch.tumblr.com. Read the original article here.