
[ad_1]
Wall Street, MSM and social are abuzz with Santa Claus Rally
chatter and hype this week, but everyone has it all wrong. I can see Yale’s big
grin shining down on us as his famous indicator and catchphrase reverberate on
The Street.
They argue their case for why the “Santa Claus Rally” will
or won’t come to town this year. But they miss the point. Yale Hirsch invented
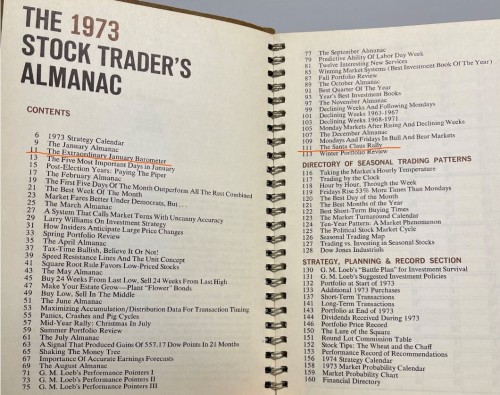
and named the Santa Claus Rally in 1972, published in the 1973 Almanac. Oh
lord, it is still misunderstood. It’s not a trading strategy, it’s an
indicator!
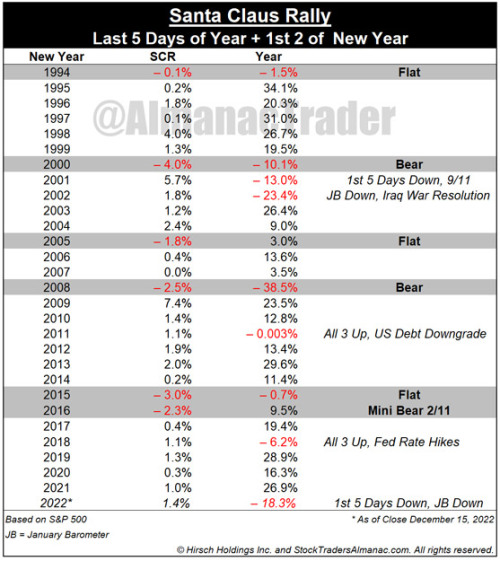
SCR is the short, sweet rally that runs from the last 5
trading days of the year to the first two trading days of the New Year. S&P
500 posts an average gain of 1.3%. Failure to rally tends to precede bear
markets or times when stocks could be purchased at lower prices later in the
year.
To wit Yale’s famous line: “If Santa Claus Should Fail To
Call, Bears May Come To Broad And Wall.” (Stock
Trader’s Almanac 2023 p 118).
The current situation is reminiscent of 1974. Midterm
October low, December retest. Lots of dire news and conditions. The Fed is
clearly done taking orders from Wall Street and Washington and is bent on
halting inflation. Their quarterly dot plot ticked up and it looks like at
least one more 50bps hike. It’s working, inflation is decelerating. Reality is
we will have higher inflation and rates for a while.
But we have already been in a bear and likely a recession. Bear
markets bottom before recessions end and bull markets start when The Street least
expects and practically everyone is a bear right now. While it sure looks ugly
out there, we contend the worst is behind and a nascent bull is trying to emerge.
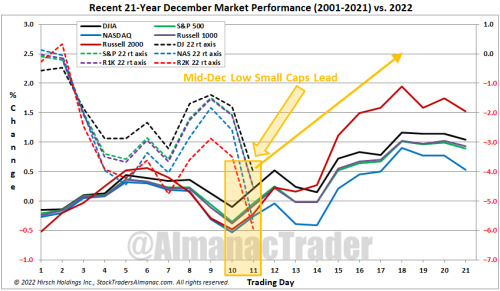
Stocks tend to bottom here in mid-December ahead of the
seasonally strong last half of the month, especially small caps – what used to
be the “January Effect.”
The results of the Santa Claus Rally along with the other
two components of our “January Indicator Trifecta,” the first five days of
January and the full month January Barometer (also created by Yale Hirsch in
1972) will help solidify our outlook for next year.
When all three are up the S&P 500 has been up 90% of the
time, 28 of 31 years, with an average gain of 17.5%. When any of them are down
the year’s results are reduced and when all three are down the S&P was down
3 of 8 years with an average loss of -3.6% with bear markets in 1969 (-11.4%),
2000 (-10.1%) and 2008 (-38.5%), flat years in 1956 (2.6%), 1978 (1.1%) and
2005 (3.0%). Down Trifecta’s were followed by gains in 1982 (14.8%) and 2016
(9.5%).
Keep your eye on the SCR for signs of a new bull or continuing
bear. Then watch for the rest of our “January Indicator Trifecta” FFD and JB. When
all 3 agree the market generally follows suit.
We are anticipating a SCR this year. Inflation is easing,
the Fed is likely to be done with rate increases in Q1 and we also see supply
chain constraints fading now that China is loosening its Covid-19 restrictions.
Seasonally speaking, we are also in the middle of the historically strongest
period for stocks, the “Sweet Spot of the 4-Year Cycle,” Q4 of midterm years
through Q2 of pre-election year.
[ad_2]
Image and article originally from jeffhirsch.tumblr.com. Read the original article here.