

[ad_1]
Oscar Gonzalez/iStock via Getty Images
Introduction
As it has been about two years since I last discussed Capgemini (OTCPK:CAPMF) (OTCPK:CGEMY) in this article (paywalled); it’s about time for an update on the stock. The share price is currently trading at approximately EUR175, which is about 25% below the 52-week-high but still about 50% higher than the EUR117 the stock was trading at when the previous article was published.
Yahoo Finance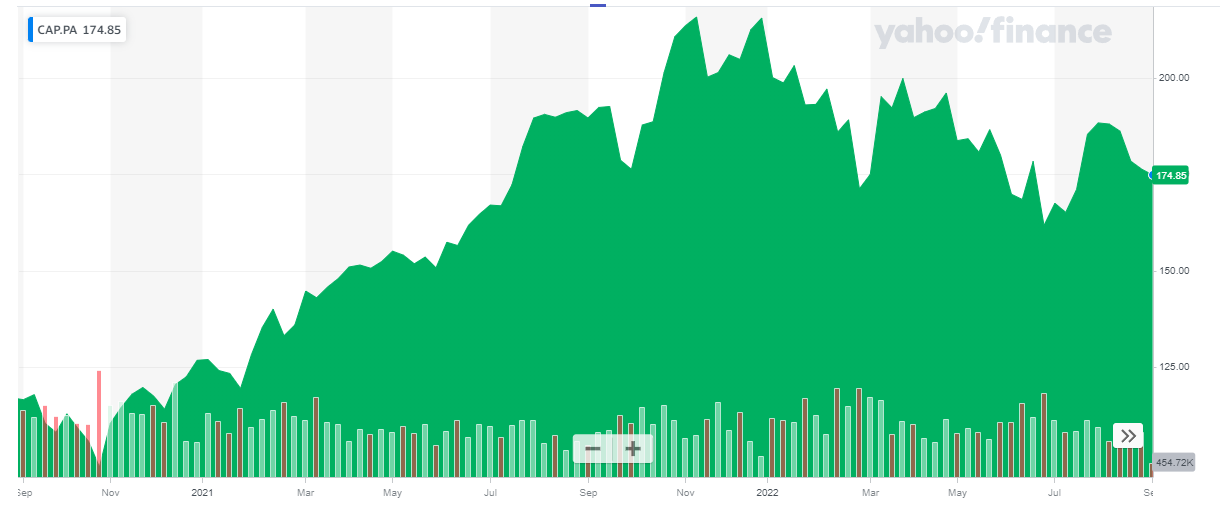
I strongly recommend to trade in Capgemini’s shares through the facilities of Euronext Paris, where it’s trading with CAP as its ticker symbol. The Paris listing is obviously more liquid than the US listing. Capgemini currently has 172M shares outstanding, resulting in a current market capitalization of approximately EUR30B. As Capgemini reports its financial results in EUR and has its main listing in EUR, I will use the Euro as the base currency throughout this article.
For a better understanding of the company’s business model, I’d like to refer you to the older article as I will solely focus on the current financial situation of Capgemini in this article. Unfortunately, Capgemini’s website mainly contains download-only links, but you can find all relevant data and information here.
The cash flows are clearly accelerating in the first semester
In the first semester of this year, Capgemini reported revenue of almost EUR10.7B in the first half of this year, which is a substantial increase of almost 25% compared to EUR8.7B in the first half of last year. The cost of services rendered obviously increased as well, but all other operating expenses seemed to have increased in line with the revenue increase, whereas Capgemini reported an operating result (confusingly called ‘operating margin’ in the income statement) of EUR1.04B on an EUR8.71B revenue in H1 2021 (for an operating margin of 11.96%, the operating margin in the first semester of this year was approximately 12.17%. A very moderate margin increase, but this clearly helped to boost the reported operating income and the net income.
Capgemini Investor Relations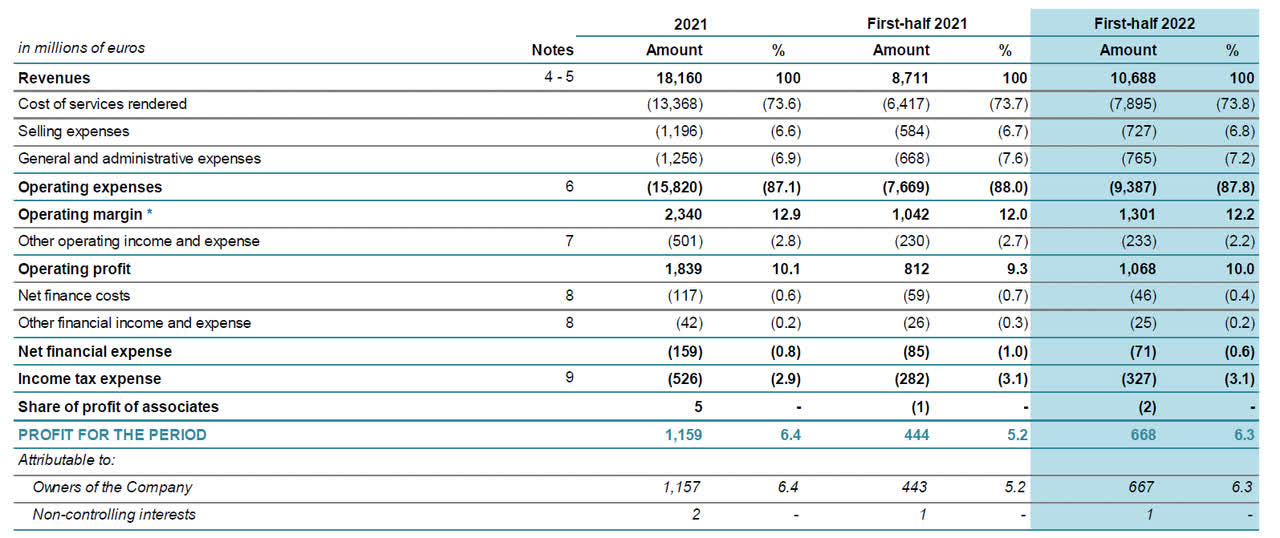
The bottom line shows a net income of EUR668M, of which EUR667M was attributable to the shareholders of Capgemini (with the remaining EUR1M attributable to non-controlling interests) and divided over the 172M shares outstanding during the first semester, the EPS was approximately EUR3.88 per share. As Capgemini uses the average share count during the semester, the EPS was approximately EUR3.91.
The cash flows were also very strong, but we need to apply numerous adjustments before figuring out the normalized operating cash flow. As you can see below, the reported operating cash flow was EUR569M, but this includes a total investment of EUR827M in the working capital elements. That being said, keep in mind the company’s tax bill was EUR327M based on the H1 results, but Capgemini only paid EUR104M in cash taxes so to be correct, we should deduct an additional EUR223M in taxes owed but not yet paid. We should also deduct the EUR74M in net interest expenses as well as the EUR157M repayment of lease liabilities.
Capgemini Investor Relations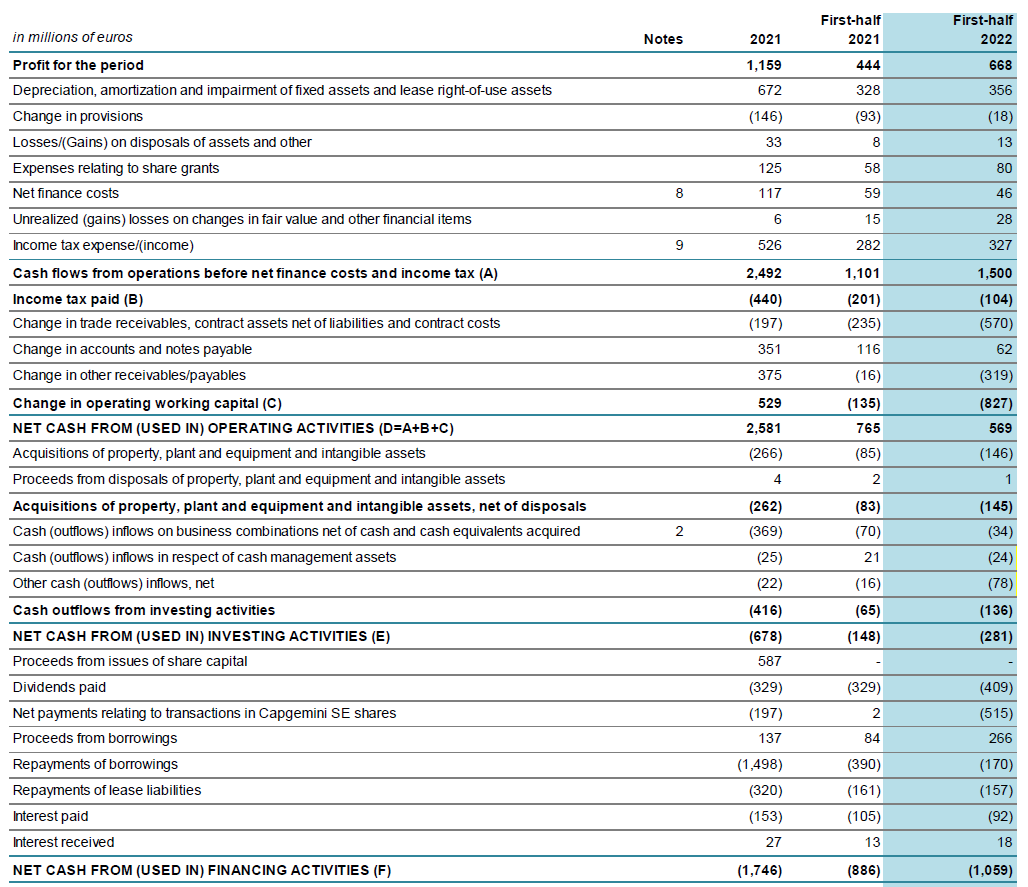
When we take all those elements into consideration, the adjusted operating cash flow in the first semester was approximately EUR942M. And with a total capex of EUR146M, the free cash flow came in at almost EUR800M for a free cash flow per share of roughly EUR4.6 per share. That’s substantially higher than the EUR193M in ‘organic free cash flow’ reported than the company, mainly because that result does not adjust the reported operating cash flow for tax payments and working capital investments.
Capgemini Investor Relations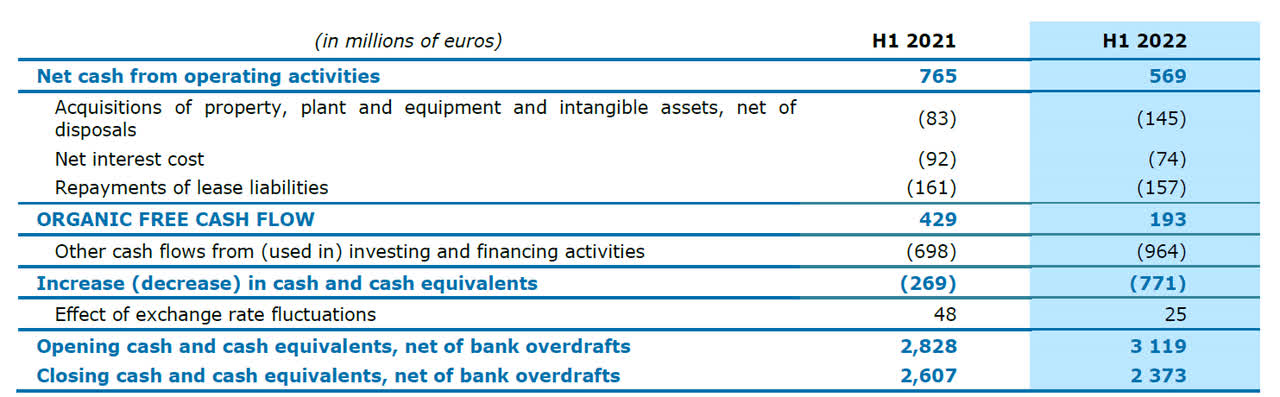
This makes it also a little bit difficult to fully understand Capgemini’s full year guidance. As you can see below, the company is guiding for a full-year organic free cash flow of in excess of EUR1.7B (which would be close to EUR10 per share). However, as the organic free cash flow calculation as proposed by the company includes changes in the working capital and does not take the tax differences into account, it’s hard to say that indeed is a reliable guidance.
That being said, with an adjusted free cash flow of almost EUR800M in the first semester, the company’s guidance likely won’t be too far off.
Capgemini Investor Relations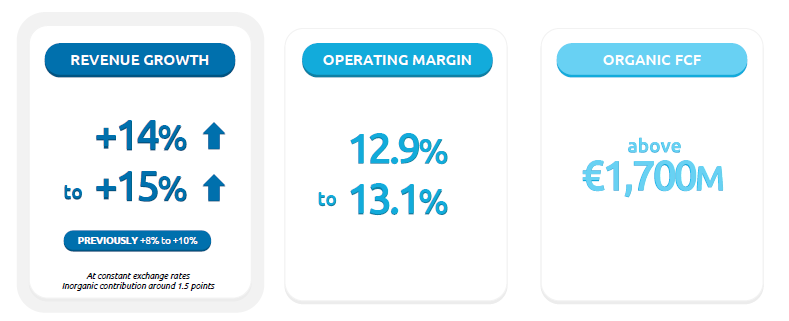
Investment thesis
I clearly missed the boat here as the share price almost doubled relatively shortly after my 2020 article was published. I did make some money on the option premiums as one of my strategies was to write out of the money put options. Capgemini still isn’t expensive at the current share price as the free cash flow yield will likely come in at around (or slightly exceeding) 10% while the company’s net debt position was just EUR4.5B (excluding lease liabilities) and just under EUR4.1B if you’d include the ‘cash management assets’ (which are bonds and other liquid investments) in the equation.
With an anticipated EBITDA of around EUR3B in 2023 (excluding the lease depreciation expenses), the debt ratio will be just over 1.33 (and decreasing as Capgemini is generating substantial amounts of free cash flow) and with an EV/EBITDA multiple of just over 11, the company doesn’t appear to be outrageously overpriced. Perhaps I will re-apply my old strategy of writing put options.
[ad_2]
Image and article originally from seekingalpha.com. Read the original article here.