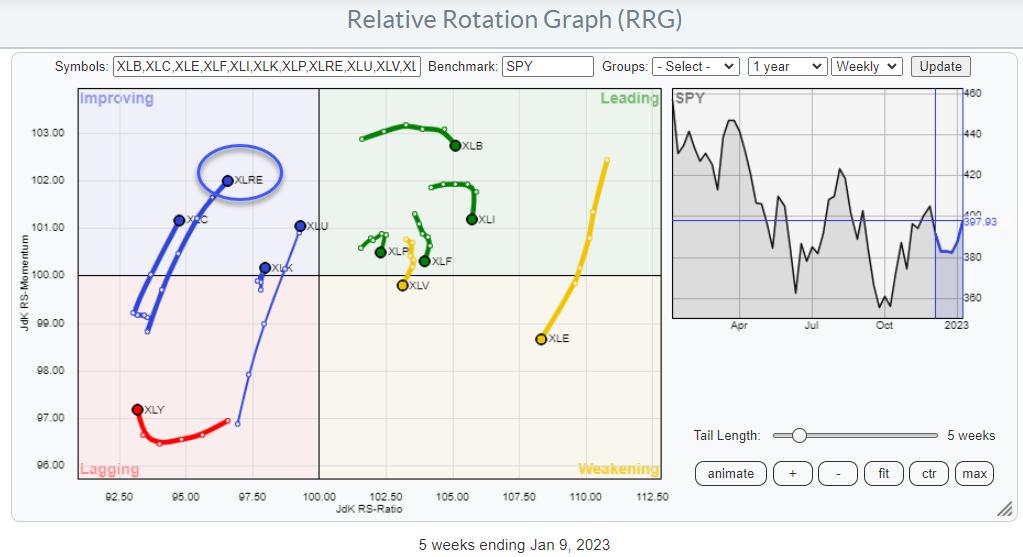
On the Relative Rotation Graph for US sectors, the tail for XLRE, the Real Estate Select Sector Fund, is inside the improving quadrant and heading towards leading at a positive RRG-Heading.
This is one of the few tails with a positive RRG-Heading, between 0-90 degrees. The other ones are Utilities, recently discussed in this article, Communication Services, and Information Technology. Interestingly enough, they are all inside the improving quadrant.
None of the tails inside leading or weakening are on a positive RRG-Heading. This suggests that some shift in sector rotation and leadership is underway.
For this article, I will focus on the developments in and around XLRE.

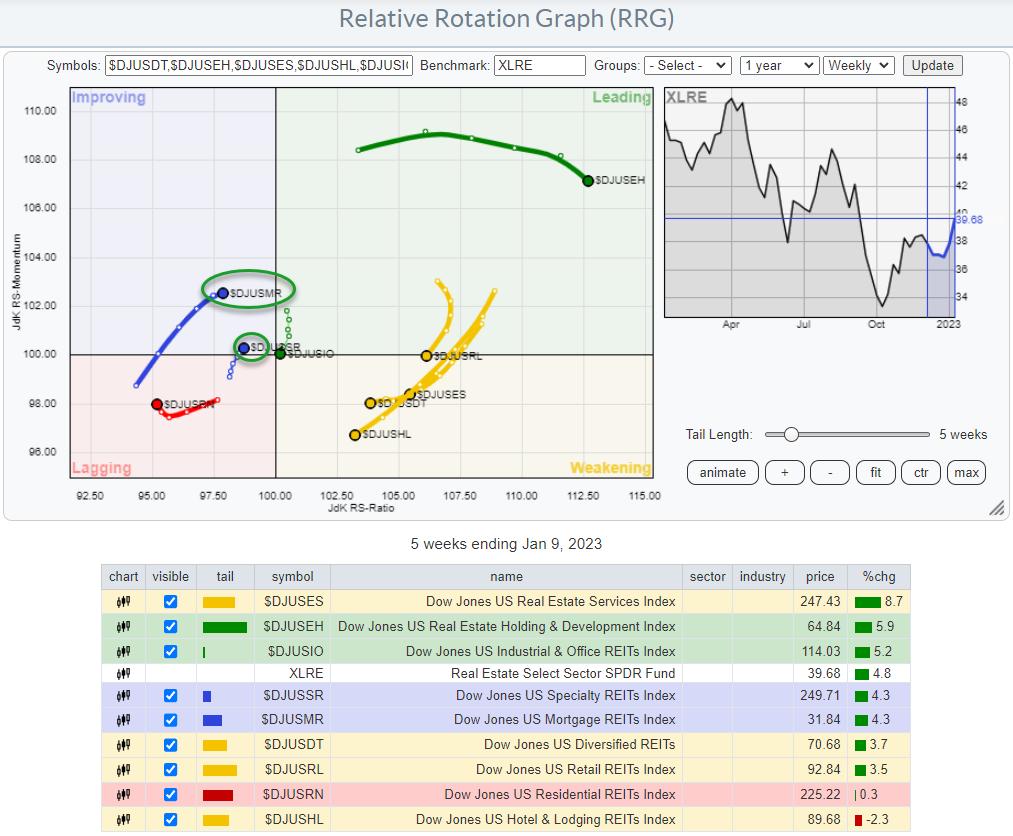
This RRG shows the XLRE sector broken down into industry groups, their rotation around XLRE as the benchmark. It is interesting to see the considerable dispersion between these groups compared to their sector index. When plotted against $SPX, more groups are showing a stronger tail, which, of course, is not surprising given the overall improving strength of the sector as a whole.
The second RRG shows why XLRE has emerged inside the improving quadrant at a strong heading. The tails inside leading, $DJUSEH and $DJUSIO, and inside weakening, $DJUSES, $DJUSDT, $DJUSRL$DJUSHL, have led the charge so far, but they are now all starting to roll over and lose relative momentum.
The good news is that almost all of these tails, except for $DJUSIO, are still quite far from the 100-level on the JdK RS-Ratio axis, which gives them a good chance of curling back up before crossing over into lagging.
For the time being, the leadership inside this sector seems to be shifting to Specialty REITs and Mortgage REITs.
Specialty REITs

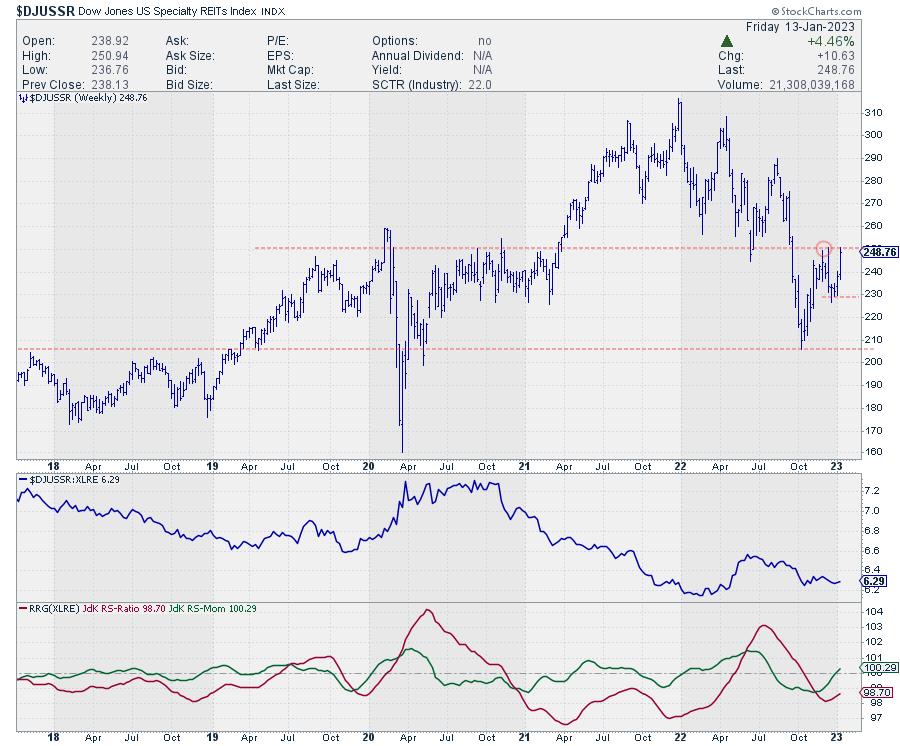
On the chart of the Specialty REITs, price is pushing against a heavy overhead resistance level, which goes back to 2019/2020 when it served as resistance. After breaking that level upwards, that same area started coming back as support in 2022, and now, again, it is coming into play as resistance.
The RRG-Lines are picking up strength, and with JdK RS-Momentum just crossing above 100 and RS-Ratio following momentum upward, the tail on the RRG is now inside improving and moving towards leading. A break above the recent peak in price will undoubtedly help further improve relative strength, but it will also trigger a new series of higher and higher lows.
Hence, I am keeping my eyes open for a break above 251 in $DJUSSR in the coming weeks to ignite a further rally in Specialty REITs.
Mortgage REITs

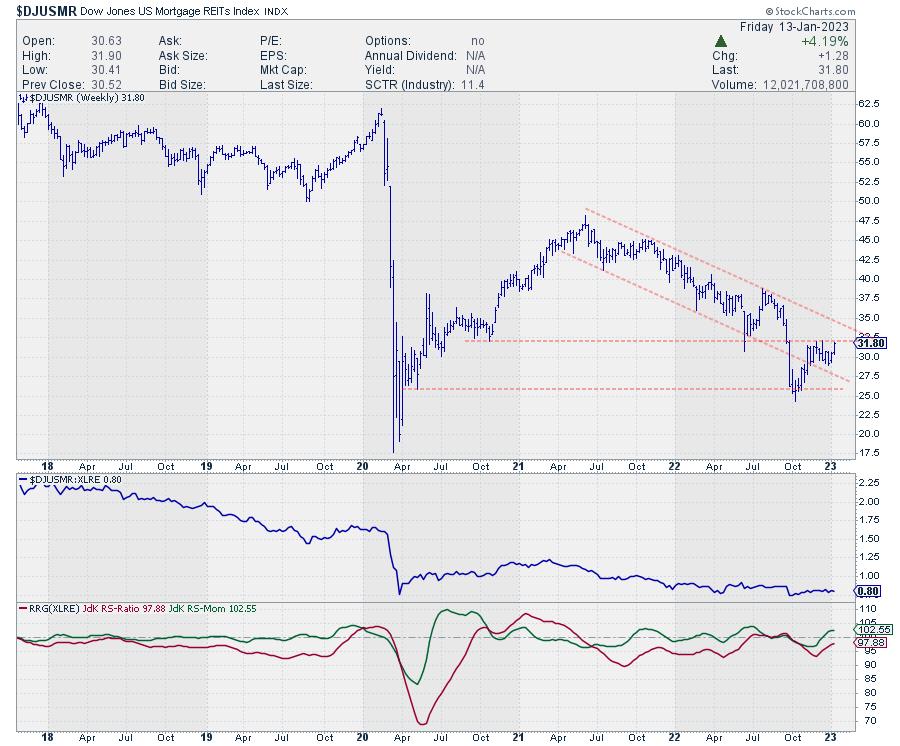
The Mortgage REITs index looks quite different, especially from a longer-term perspective. Where specialty REITs managed to rally strongly after the initial decline at the start of the pandemic in 2020, Mortgage REITs are nowhere near the prior pandemic levels.
On the chart above, you can see how Mortgage REITs have moved in a down-sloping channel since mid-2021 in a very regular series of lower highs and lower lows—and finally breaking lower out of that channel, accelerating to its recent low around 25. Out of that recent low, the current rally started to take shape.
The first positive takeaway was getting back into that falling channel. Breaking back into an old channel often leads to a test of the opposite side. In this case, the falling resistance line is currently somewhere just below 35.
Just like specialty REITs, its Mortgage equivalent is also pushing overhead resistance from a prior high. If this level can be taken out in coming weeks, that will, first of all, free the way toward that falling resistance near 35, but it will also trigger the start of a new series of higher highs and higher lows.
Once that new trend emerges, together with continued improvement in relative strength, Mortgage REITs are expected to be one of the leading groups within the Real Estate sector.
Have a great weekend, –Julius
Julius de Kempenaer
Senior Technical Analyst, StockCharts.com
Creator, Relative Rotation Graphs
Founder, RRG Research
Host of: Sector Spotlight
Please find my handles for social media channels under the Bio below.
Feedback, comments or questions are welcome at Juliusdk@stockcharts.com. I cannot promise to respond to each and every message, but I will certainly read them and, where reasonably possible, use the feedback and comments or answer questions.
To discuss RRG with me on S.C.A.N., tag me using the handle Julius_RRG.
RRG, Relative Rotation Graphs, JdK RS-Ratio, and JdK RS-Momentum are registered trademarks of RRG Research.


