

[ad_1]
IvelinRadkov
Sometimes an article ages well. In April 2021, I wrote “What Is The Long Bond Tipping Point For Stocks?” I have not had much to say until we blew past the tipping point with the 10-year Treasury bond exceeding 4% and the S&P 500 falling more than 20%, so I thought it was time to revisit the RPF model.
The Risk Premium Factor Model (RPF Model) can help understand the S&P 500’s valuation to identify bubbles and opportunities. It is built on a simple constant growth equation where: P = E / (C – G) and explains S&P Index levels with good accuracy for 1960-present using only the risk-free rate, S&P 500 operating earnings and some simplifying assumptions. While most analysts acknowledge the important relationship between earnings and interest rates, the RPF Model qualifies it.
Understanding that these are the most important factors can help cut through much of the analytical noise to help investors focus on fundamentals. In the past, I’ve called this ‘Moneyball’ for the Stock Market.
I first developed the Risk Premium Factor Model (RPF for short) in 1999 and published it in the Journal of Applied Corporate Finance in 2010 and in a book published by Wiley in 2011. I’m pleased to report that more than ten years after publishing and nearly 20 years after conceiving the idea, it still works.
The RPF Model is used to determine the intrinsic value of the market and understand the implied value of the components that drive the market: earnings and long-term interest rates, which drive the cost of capital and embody expected inflation.
In short, the model says that:
Intrinsic value of the S&P 500 Index = S&P operating earnings/(long-term treasury yield x 1.48 – 0.6%)
The model shows that equity prices (via the SPDR S&P 500 Trust ETF (NYSEARCA:SPY)) move inverse to yield. In the equation, 1.48 is the Risk Premium Factor and 0.6% is the difference between long-term expected growth and real interest rates. It is a perpetuity formula that values the index based on current earnings using a cost of capital driven by interest rates. I’ve written about the model numerous times, so rather than repeat my entire overview of the model, you can read about it on Seeking Alpha.
To adjust for the Fed’s artificially depressing long-term rates, the model uses normalized yields on Treasuries of 4.5% from August 2011 and 4.0% from January 2015 through September 2022.
Finally, after almost 14 years in March 2022, the Federal Reserve has stopped buying its own securities in the open market, otherwise known as quantitative easing. The result is Treasury yields are now market priced rather than artificially depressed. This has allowed yields to rise from 1.84% at the end of February 2022 to 4.24% at the time of this writing.
The chart below illustrates how the model has performed historically:
S&P 500 Index Actual vs. Predicted (S&P Earnings, Yahoo Finance, Stephen D. Hassett Analysis)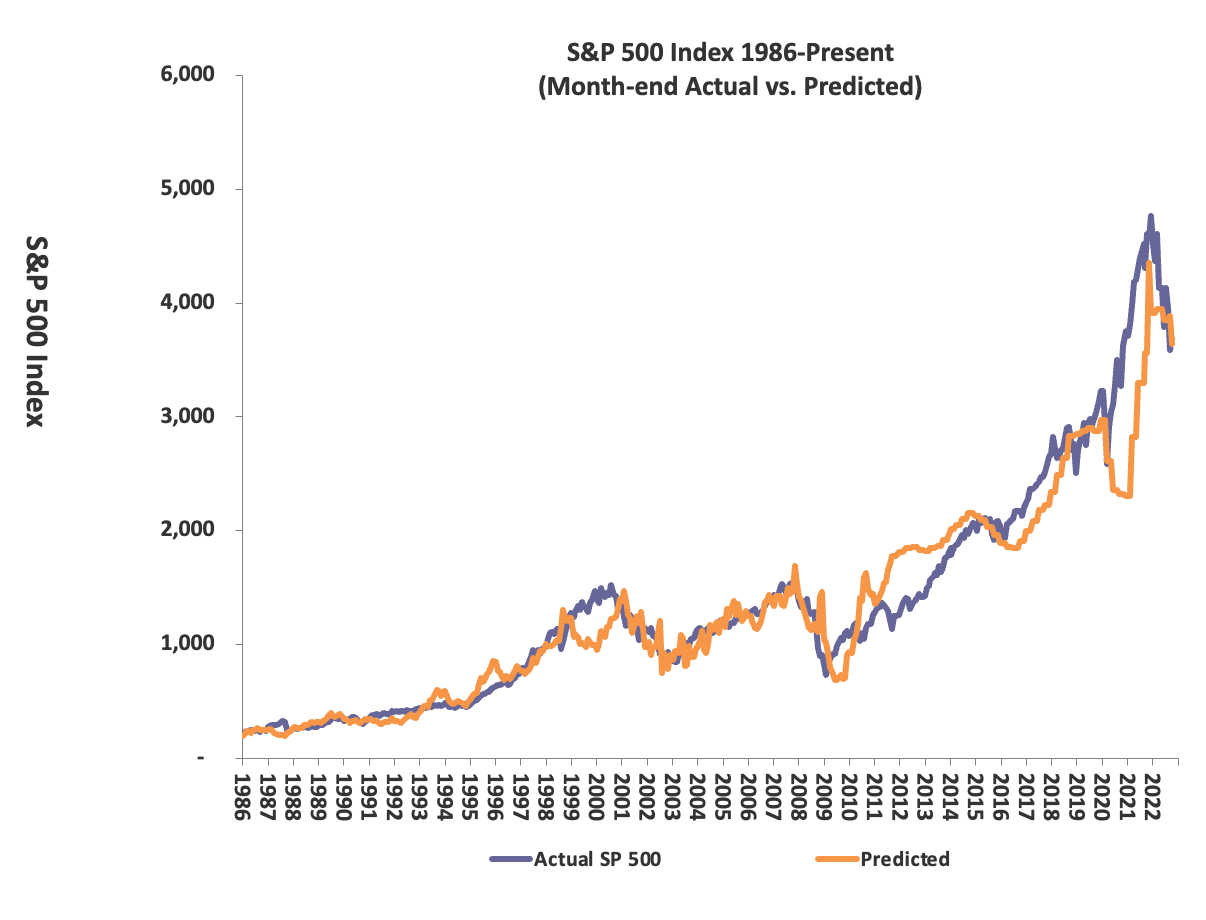
How sensitive is the S&P 500 to earnings and interest rates?
If you’ve read my past articles, going back to 2010, you’ll know that I don’t forecast earnings and I don’t forecast interest rates. The RPF Model requires earnings and interest rate inputs to determine fair value, so it can tell you what earnings and interest rates are required to support current valuations.
The market has a linear relationship with earnings. The chart below shows predicted price of the S&P 500 to earnings while holding interest rates constant. As you can see, it’s a simple linear relationship.
Stephen D. Hassett Analysis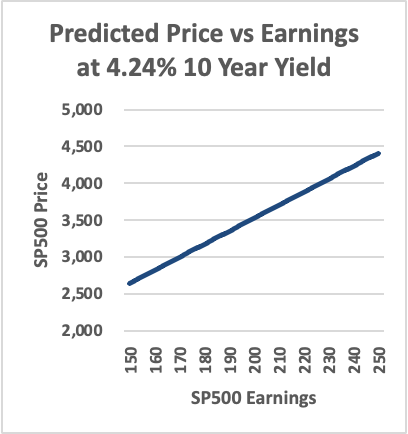
More interesting is the relationship between S&P Price and interest rates. The charts below show the predicted S&P 500 price and P/E while holding earnings constant at the current level.
S&P 500 Price vs. 10-year yield (Stephen D. Hassett Analysis)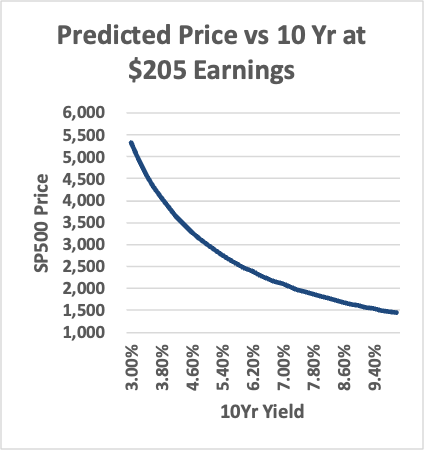
S&P 500 P/E vs. 10-Year Yield (Stephen D. Hassett Analysis)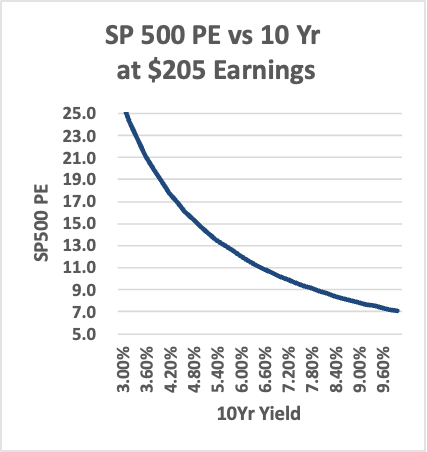
As shown, this relationship is non-linear with price and P/E highly sensitive to 10-year Treasury yield.
Earnings and interest rates are the key this year… and every year
Based on current S&P 500 Earnings and actual 10-year yields, the market is fairly valued as of this writing (mid-day 10/21/22). But with the Fed poised to increase its rate by another 0.75% in November to 4.0%, we have cause to worry about further increases to the 10-year yield. However, this is public information and the expectation may already be factored into the current yield, so it is possible that we will not see another interest rate shock. The table below shows that S&P’s forecast for Operating Earnings is expected to hold steady for the year and rise in 2023. In other words, no recession impact on earnings. If these two elements hold true, we have reached the bottom with the market poised to increase almost 14% in 2023.
S&P 500 Predicted Price and Implied 10-year yield (S&P Earnings, Yahoo Finance, Stephen D. Hassett Analysis)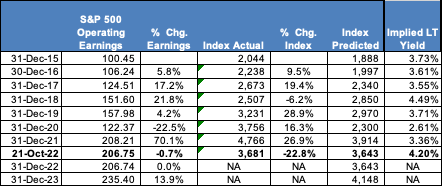
[ad_2]
Image and article originally from seekingalpha.com. Read the original article here.