[ad_1]
simpson33
The popular streaming giant Netflix (NASDAQ:NFLX) reports its fourth quarter earnings this coming Thursday and coincidentally, a bullish third wave has broken out towards the early $500 region before the big news lands.
In general, this is a conundrum for investors and is seen as a roll of the dice to place an order buying Netflix shares without all the latest figures at their disposal.
But in my world a third wave breakout is a third wave breakout and the bullish technicalities cannot be ignored. Firstly we will retrace back in time slightly to discover how Netflix plummeted from the $700 region to the sub $200 price range on the back of an earnings report last year before covering what latest information may be available about the company going forward, and finally, we will move to the technicalities behind my buy signal for this equity.
The dramatic fall in share price last year started with Netflix announcing a decline of 200,000 subscribers that saw a 68% decline in the price of Netflix shares in the first four months of 2022. Figures seem to peak for Netflix during the pandemic lockdown and unable to re produce those type of numbers coupled with rising competition in the market from the likes of Apple TV, Disney+ and HBO Max, all of which are not exactly shrinking violets of corporations themselves, things were looking very challenging for Netflix.
So what has caused an apparent bottoming and technical breakout of a bullish third wave in what has been a remarkable turnaround for this equity?
One theory is that growth could be expected to slow slightly but to have steadied going forward, which would be a welcome addition to investors. The main catalyst I would expect will be Netflix’s addition of digital ads to its platform. This ad supported option was launched in November and could be a very welcome additional revenue stream for Netflix, with the company working tirelessly to find a way of turning fortunes around after a dismal spell which is now clearly being reflected in the share price bounce.
Now we will move to the monthly charts to look at where Netflix is technically due to land next.
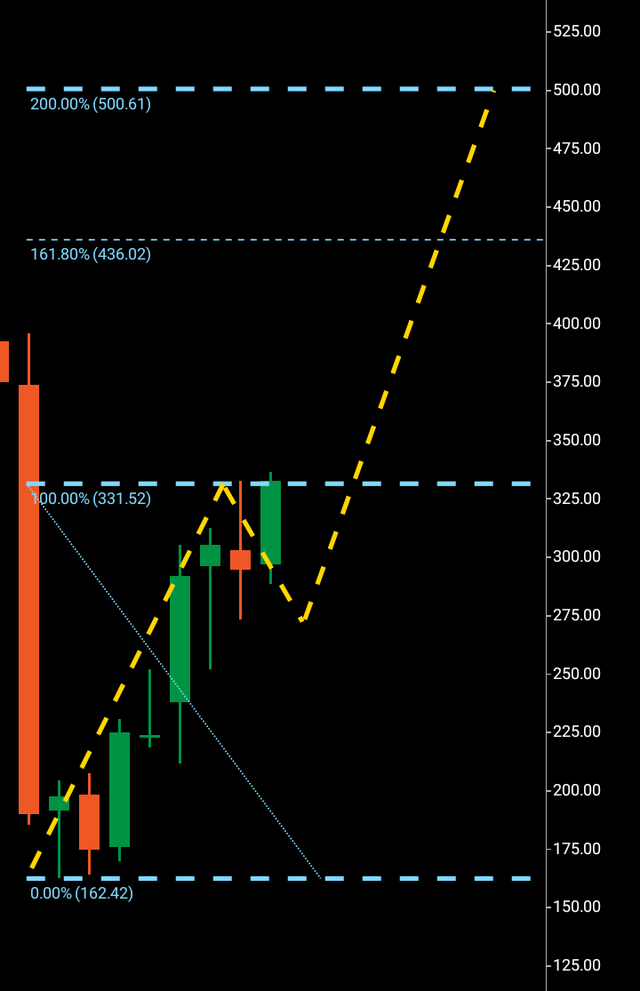
Netflix monthly chart (C Trader )
Firstly, we can see the bottoming bullish candle at $162. The next monthly candle finished in bearish form and actually re traced to $164 just avoiding a new low by a couple of dollars. We can then see four months of steady buying with bullish green candles having being printed until the all-important rejection candle which was printed in December having topped out at $332. So we can identify the wave one $162-$332, the short wave two $332-$273 and a break above the rejected $332 area commencing the third wave to $500.
So how will this wave land at this targeted price region before making its next directional decision?
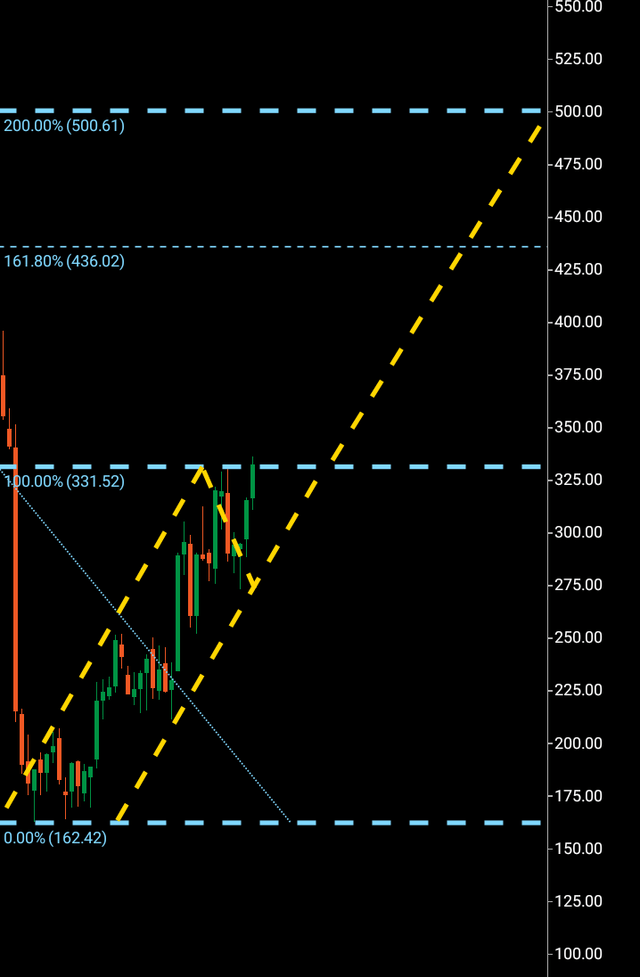
Well, that is the big question. There are a few ways it could land. If we look at the weekly chart below, we can see a steady directional climb with the piercing of resistance $332 in shot.
Netflix weekly chart (C Trader )
The wave two retrace is quite short, so a possibility could be that the earnings release isn’t immediately favorable, seeing the price re tracing past $273 but staying above $162 which would keep the bullish move in play. The next possibility is, of course, a wave fail where this move above resistance is a fallout and Netflix will return to drop below $162 before touching the $500 region.
Lastly, this set up could see a direct move towards $500, after all, that is what it is technically set up for. The third wave has broken above resistance on a macro chart, and we have a printed wave one with a numerical length of $170 before the rejection, so we can expect another $170 move from now for a numerical wave one copy before a significant next rejection.
To finalize, I am issuing a buy for Netflix with a $500 target. All the possibilities are outlined above and would expect Netflix to arrive at the target region within the next 30-120 days.
About the Three Wave Theory
The three wave theory was designed to be able to identify the exact probable price action of a financial instrument. A financial market cannot navigate it’s way significantly higher or lower without making waves. Waves are essentially a mismatch between buyers and sellers and print a picture of a probable direction and target for a financial instrument. When waves one and two have been formed, it is the point of higher high/lower low that gives the technical indication of the future direction. A wave one will continue from a low to a high point before it finds significant enough rejection to then form the wave two. When a third wave breaks into a higher high/lower low, the only probable numerical target bearing available on a financial chart is the equivalent of the wave one low to high point. It is highly probable that the wave three will look to numerically replicate wave one before it makes its future directional decision. It may continue past its third wave target, but it is only the wave one evidence that a price was able to continue before rejection that is available to look to as a probable target for a third wave.
[ad_2]
Image and article originally from seekingalpha.com. Read the original article here.
