[ad_1]
Bet_Noire
Introduction
A lot of market commentary as of late has been focused on the large-cap indices such as the S&P500 (SP500), the Nasdaq 100 (NDX) and the Dow Jones Index (DJI). This is unsurprisingly given the sharp falls by the tech leaders of the last decade; Apple (AAPL), Google (GOOG), Microsoft (MSFT), Meta (META), Netflix (NFLX), Tesla (TSLA).
But how have the mid caps and small caps done? In a recent previous article, I analyzed Vanguard’s Russell 2000 small-cap index (VTWO). In this piece, I compare its cousin, the Vanguard Extended Market Index Fund ETF (NYSEARCA:VXF), which consists of a mid-cap and small-cap blend.
VXF and VTWO ETF Compositions
Sector Weight Comparisons
VXF, VTWO ETF Sector Exposure (VXF, VTWO ETF Website, Author’s Analysis)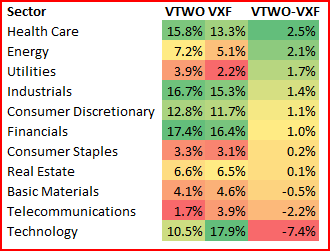
The table above shows the sector weights of the VTWO and VXF ETFs. Although they have similar sector-wise compositions, a main difference is observed in the heavy concentration of the technology sector in VXF, which has 7.4% relative overweight compared to VTWO. While financials, industrials, and consumer discretionary occupied the top 3 sectors for VTWO, technology, financials, and industrials were the major dominant sectors in VXF ETF.
VXF ETF Top 5 Holdings Composition
VXF ETF Top 5 Holdings (VXF ETF Website, Author’s Analysis)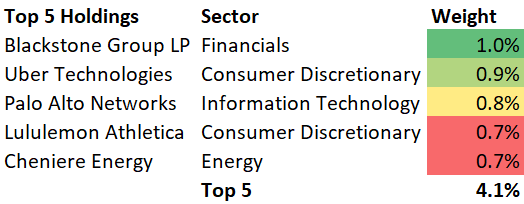
The top 5 holdings for VXF constitute only 4.1% of the total exposure, suggesting that it is a well-diversified ETF. There is broad sectoral exposure in the top 5 names. The top 5 holdings for VXF are Blackstone Inc. (BX), Uber Technologies Inc. (UBER), Palo Alto Networks Inc. (PANW), Lululemon Athletica Inc. (LULU), Cheniere Energy Inc. (LNG). The top 5 holdings contribution is greater than VTWO by 2.6%. Further details on VTWO’s top 5 composition is shown here.
Key Fundamental Drivers for VXF and VTWO
The key fundamental drivers and monitorables are the usual suspects: interest rates and recession developments. I have written about these themes in-depth in my article on VTWO.
Technical Analysis
If this is your first time reading a Hunting Alpha article using Technical Analysis, you may want to read this post, which explains how and why I read the charts the way I do, utilizing principles of Flow, Location and Trap.
Read of Relative Money Flow – VXF
VXF vs SPX500 Technical Analysis (TradingView, Author’s Analysis)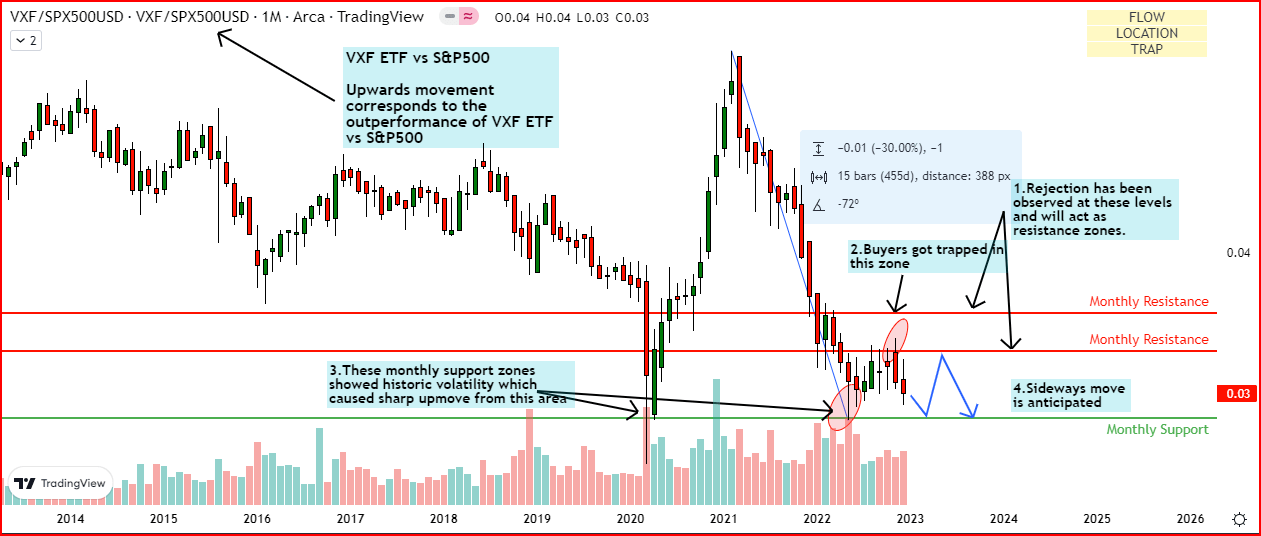
My relative money flow analysis anticipates a sideways move in VXF/SPX500. Rejections were observed at key monthly resistance levels because of a lack of interest from buyers at these levels. Prices have fallen 30% from the recent highs of 2021.
Read of Absolute Money Flow – VXF
VXF Technical Analysis (TradingView, Author’s Analysis)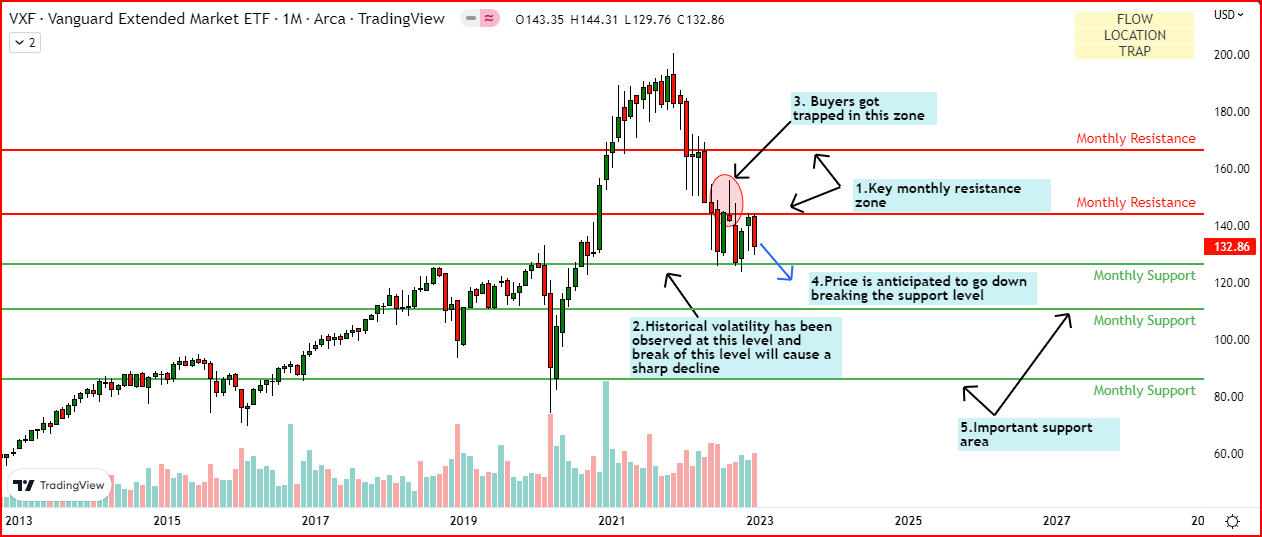
On a standalone basis, I anticipate a sharp decline in VXF. This is because buyers got trapped playing the breakout to the upside at monthly resistance levels, triggering an entry for the genuine seller move. I anticipate the price to go down and eventually break the immediate monthly support level, perhaps after some consolidation.
VXF expected to underperform VTWO
VXF vs VTWO Technical Analysis (TradingView, Author’s Analysis)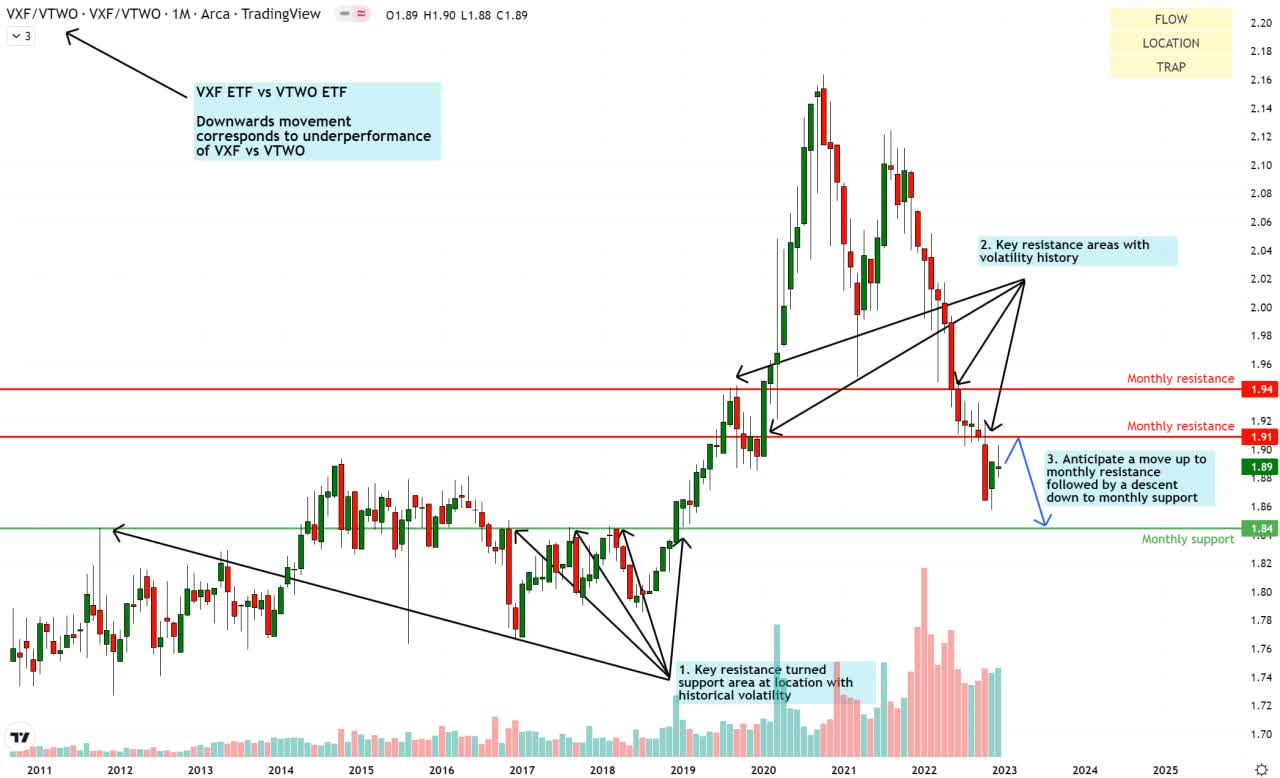
As can be seen in the chart above, I anticipate VXF to continue underperforming VTWO after a brief pullback toward monthly resistance, followed by a move down to the monthly support area. This may be due to the 7.4% higher technology exposure amid an environment when technology stocks have been major underperformers.
Summary
VXF ETF is showing a bearish trend on a standalone basis and VXF/SPX500 is showing signs of a sideways move over the coming months. I do not see much signs of bullishness in the overall small-cap and mid-cap space currently and expect the midcap weighted ETF VXF to continue underperforming the small-cap-focused VTWO over the upcoming months. As usual, I am tracking the key fundamental drivers such as interest rates and recession outlooks as I search for a tradeable direction on either VXF or VTWO. Overall, I reserve a ‘hold’ outlook on both these ETFs.
[ad_2]
Image and article originally from seekingalpha.com. Read the original article here.

