[ad_1]
Welcome to Friday everyone!
Man, there is nothing better than a good old-fashioned adrenaline rush.
And when you can do it in the safety of your own home, without risking major injury, it’s even better.
Las Vegas Sands (LVS) was my rush this past week, and I am not suggesting that I hit it big gambling online.
Instead, I emailed this detailed report alerting my Terminator Trades members to what I believed to be an imminent move higher in shares of LVS:
So what did my MANY years of experience show me that caused me to get so excited?
The tool I used is at the core of so many money management playbooks and yet so underutilized by retail traders.
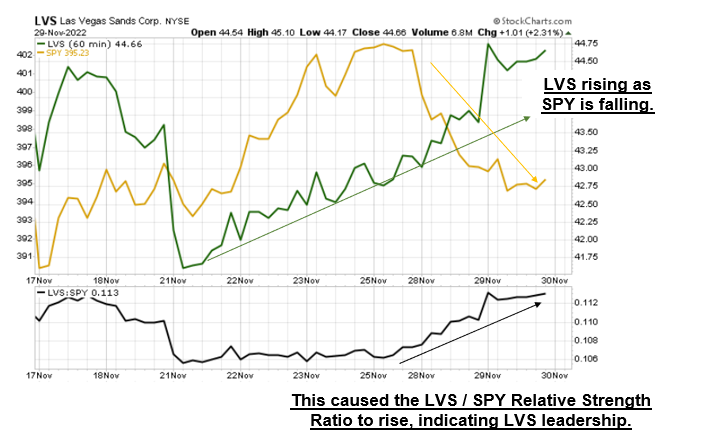
It’s called RELATIVE STRENGTH, and LVS was dominating the S&P 500 ahead of that alert.
Here’s what I mean…
On this chart, you see LVS and SPY (the benchmark) both in the top panel, and the Relative Strength Ratio (NOT RSI) in the bottom panel.

Look, there’s TONS of stocks that show relative strength vs. the S&P 500 on a daily basis.
And that’s where one of the world’s worst stock pickers, CNBC’s Jim Cramer, was actually right when he said, “There’s always a bull market somewhere.”
Where you as an ill-equipped trader struggle is with not having that NEXT LEVEL of tools that will give you an advantage by helping you identify which stocks have the best chance of moving far in a short period of time.
And that’s where my CUSTOM “Smart Money” scanners, Instant alerts, Premium watchlists, ABUNDANT educational content, and LIVE training come in.
LVS is a great example, because my Unusual Options Activity Scanner revealed BIG money coming into the short dated, out-of-the-money calls, for LVS.

From there, it was GO TIME and I sent the alert email telling members that I am interested in first the Dec 2 $45 calls and secondly the $47 Calls, both of which had big unusual options activity prior to the alert.
And what followed was the RUSH that comes with nailing the timing of a big trade!
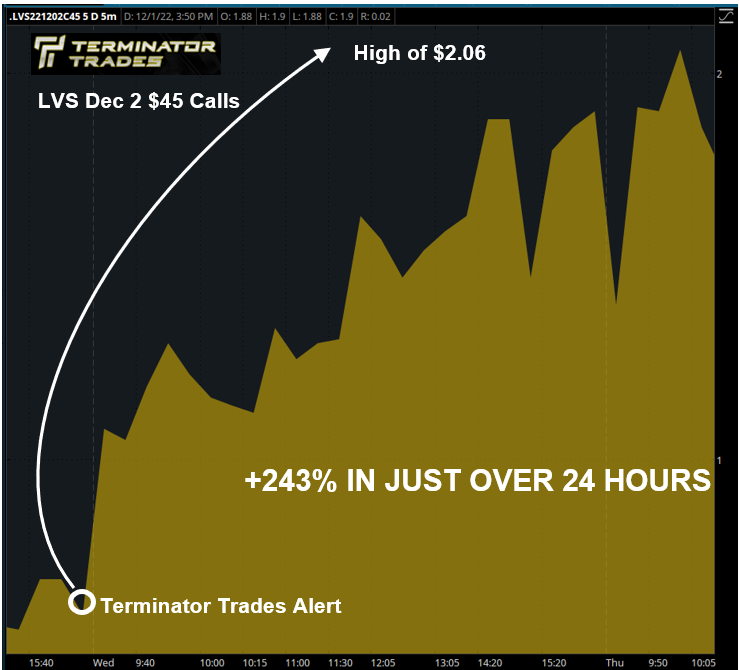
As this chart shows, those LVS Calls surged the next day, and the rise carried through into Thursday.

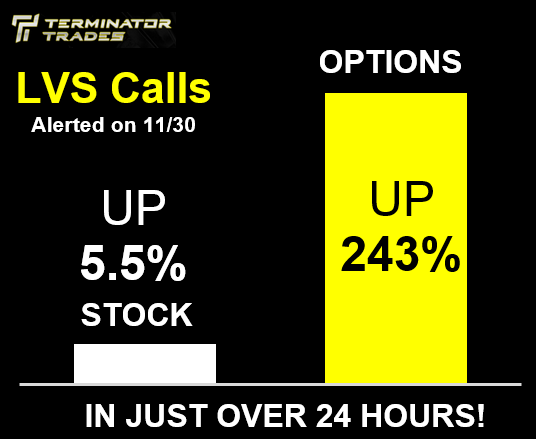
And as is usually the case, the leverage provided by options caused those Calls to increase FAR more than the underlying stock from Wednesday’s open to Thursday’s high.

Friends, this is the kind of dynamic that plays out between me and my AMAZING members, retail traders just like you, each and every trading day.
Now, I am not saying that every alert I send is a winner (because anyone who makes that claim is a fraud).
What I am saying is that my ENTIRE focus is to bring my many years of trading and education experience to the table and ENHANCE it with the power of Smart Money tools like these.
I can’t reveal it to non-members, but I am seeing that my SKYNET Dynamic Watchlist is loaded with ideas for Monday, and I am ready for my next adrenaline rush.
Let’s all have a great weekend and until next time!
[ad_2]
Image and article originally from ragingbull.com. Read the original article here.

