

[ad_1]
helen89
Intro
Shares of Weis Markets, Inc. (NYSE:WMK) have been on an absolute tear over the past 30 months or so. In fact, as we see from the technical chart below, shares have remained above their 200-day moving average since that significant move to the upside back in early 2020. The question now is whether investors may continue to ride this trend upward.
Although shares remain well above their 200-day moving average and over 11% of the float is shorted at present, this has not stopped shares from rallying aggressively to the upside. Suffice it to say, from a technical standpoint initially, shares of Weis Markets look more likely to continue rallying than to reverse at this stage. This is something that value investors especially find difficult to get their heads around. Value investors are used to investing against the grain which usually means their respective stocks have been badly beaten up by the market. Weis Markets though (despite its incessant rally) is by no means expensive at its present juncture. Shares trade with a trailing sales multiple of 0.49 and a trailing price to cash-flow multiple of 10.24. Suffice it to say, if Weis’ operating profit can continue to grow by up to 10% a year based on the above-mentioned multiples, then there is every chance, that we are only in the initial innings of this bullish move.
Weis Markets Continuing Its Ascent (Stockcharts.com)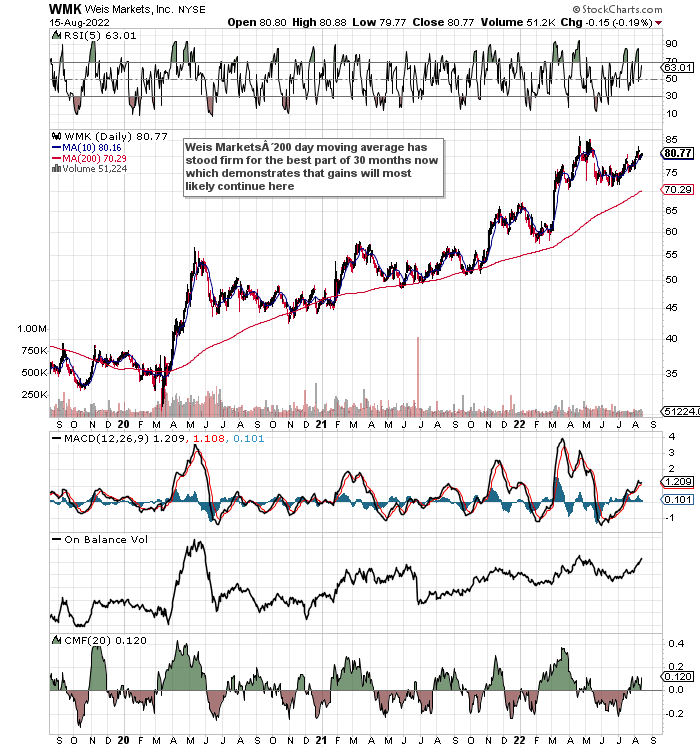
Whereas many investors focus on profitability metrics and the growth of the same when stocks are in bullish mode, it can be hard to decipher forward-looking growth rates just from this practice. What we like to look at is how the financial condition of Weis Markets has changed during this latest up-move as trends on the balance sheet can give us insights on whether this rally can be sustained. We will go through a period of the previous nine quarters which is in line with the significant up-move in shares of Weis Markets in recent times.
Cash & ST Investments
For the most part, the more cash Weis Markets has the better as this cash can be used for investing purposes and rewarding shareholders. Weis Markets reported just over $300 million of cash & short-term investments at the end of its fiscal second quarter. This is an increase of roughly $80 million over the corresponding figure at the end of Q1 ($220 million) in 2020. All things being equal, a 36% growth rate in cash & ST investments is a solid return over the past nine quarters considering quarterly sales are up approximately 15% in this time period. Shares of Weis Markets now trade for just over 7 times its liquid cash position.
Current Ratio
Many times, a company can decide to sacrifice liquidity in the short-term to boost returns and more importantly keep customers serviced. An elevated current ratio is a type of insurance in the event operations for some reason needed to come to a standstill and cash was needed quickly. At the end of Q2 this year, Weis’ current ratio came in at 2.07 which means it has climbed approximately 21% over the past nine quarters. Even if we strip off the retailer’s inventory, the quick ratio at present comes in at 1.18 versus 0.99 for the same metric at the end of Q1 in 2020. Bottom line; liquidity in Weis Markets continues to improve.
Net Property, Plant & Equipment
The lion’s share of Weis’ non-current assets and the retailer’s largest asset line-item, in general, is its stores or Property, Plant & Equipment. At the end of Q2, this line item came in at $1.15 billion which was only $57 million or 5% above the corresponding number at the end of Q1 in fiscal 2020. Suffice it to say, since sales and earnings growth easily have easily beaten 5% over the past 9 quarters, this means Weis Markets’ assets returned more earnings over the past nine quarters. This is exactly the trend we want to see as based on current trends, a larger number of assets should automatically result in accelerated earnings, all things remaining equal.
Return On Assets
We see the ramifications of what is discussed above in Weis’ return on asset profitability metric. This key metric lets us know the amount of profit being generated from every $1 of assets available. If we just take Weis’ Q2 numbers ($36.3 million of net profit on $1.926 billion of assets) and average them out over four quarters, we get an adjusted ROA of 7.54%. Doing the same for Q1 back in fiscal 2020 ($26.7 million of net profit on assets of 1.716 billion), we get an adjusted ROA 9 quarters ago of 6.22%. Another encouraging trend.
Return On Equity
Return on equity or ROE is another sound profitability metric to use in Weis Markets because the company carries no debt and runs a stable share count. Both of these variables (debt & the number of shares outstanding) can provide misleading trends in a company’s return on equity profile due to changes in shareholder equity. Again, all I am looking for here is outperformance in Weis’ earnings over the past nine quarters compared to the company’s equity and that is what we see once more. Whereas shareholder equity has increased by roughly $186 million or 17.3% to arrive at $1.263 billion at the end of Q2 this year, net earnings have increased by $9.6 million or almost 36% over the past nine quarters. Return on equity over the past four quarters for the record almost hit 10%.
Conclusion
Weis Markets’ balance sheet trends are definitely matching up with how the stock’s technicals are behaving at present. Earnings growth is outpacing both the company’s asset and equity growth, cash is expanding and so is liquidity in general. Furthermore, equity or book value continues to grow. We see the year-to-date highs registered earlier this year easily being taken out in this present rally. We look forward to continued coverage.
[ad_2]
Image and article originally from seekingalpha.com. Read the original article here.