

[ad_1]
Martin Barraud/iStock via Getty Images
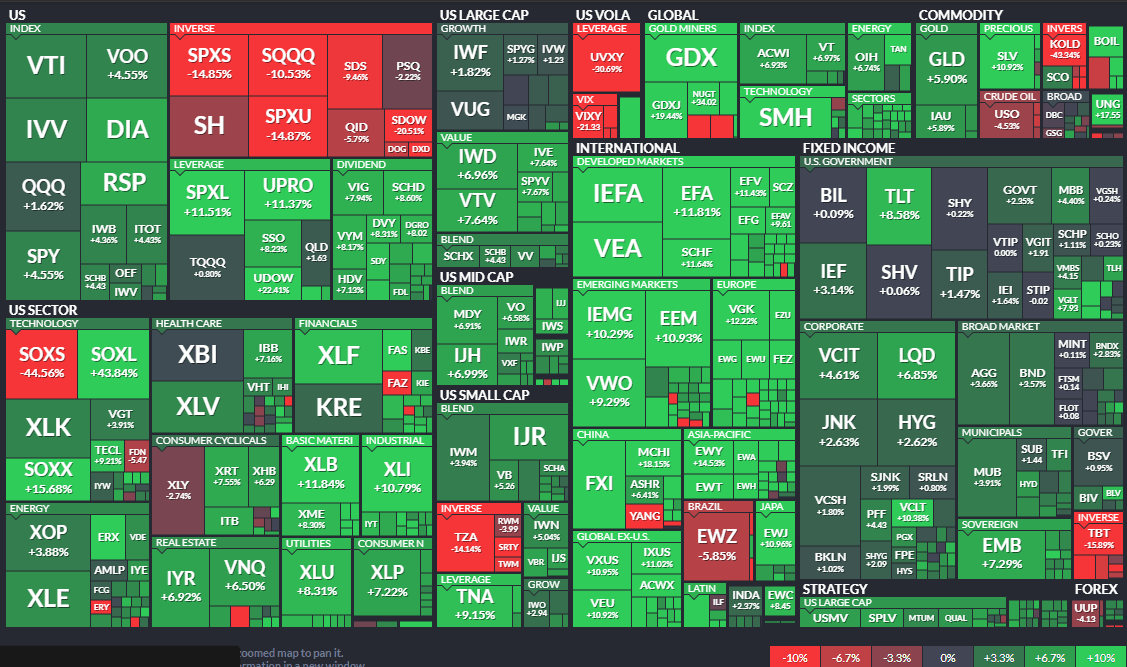
The Materials sector has led the S&P 500 over the past month. A risk-on atmosphere and a lower U.S. dollar are big tailwinds for this economically sensitive area. Recent outperformance among global firms is also generally beneficial for metals and mining equities that rely somewhat on ex-U.S. growth prospects. I continue to like the valuation and price action on one of the sector’s important industries.
ETF One-Month Performance Heat Map: Materials Top Sector
Finviz
SPDR S&P Metals and Mining ETF (XME) offers investors exposure to the metals & mining segment of the S&P TMI, which comprises the following sub-industries: Aluminum, Coal & Consumable Fuels, Copper, Diversified Metals & Mining, Gold, Precious Metals & Minerals, Silver, and Steel, according to SSGA Funds.
XME is a relatively inexpensive way to play cyclical metals-related stocks as it features a gross expense ratio of just 0.35%. With a weighted-average price-to-book ratio of 1.8 and a forward price-to-earnings ratio near 7, the fund is still cheap despite negative historical earnings looking back 3-5 years.
You get some small and mid-cap exposure with XME as its weighted-average market cap is $9.1 billion, per SSGA. The ETF pays a 1.04% trailing 12-month dividend yield. Finally, XME has strong liquidity, so it is ideal for both long-term investors and short-term swing traders with its 0.02% median bid/ask spread.
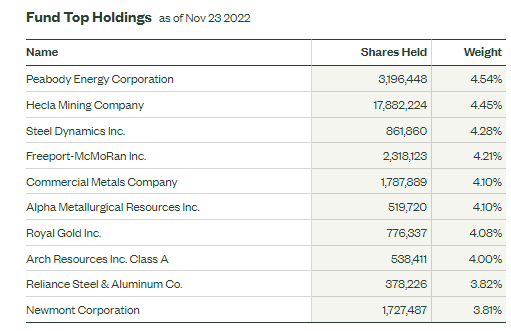
What I like about XME is that it not only has your typical copper and industrial metal companies but also exposure to the coal niche. There are no great options for ETF investors to access coal these days, so with Peabody Energy Corporation (BTU) as the top holding, there is the potential to benefit from bullish fundamentals going into the winter heating season across the northern hemisphere. Coal & Consumable Fuels make up more than 18% of XME. Steel producers are the biggest segment at nearly 40%. Finally, gold and silver comprise about 15% of the ETF.
XME Top Holdings
SSGA
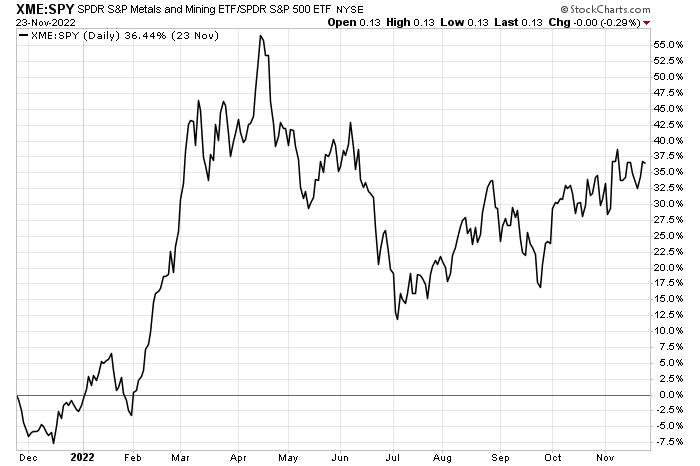
I issued a buy recommendation on XME back in early September. That proved to be a decent call, but nothing gangbusters. XME is up more than 6% since then but notice in the chart below that the metals & mining area continues to steadily outperform the broad market.
What I also like about this part of the equity space right now is that the dollar appears to be rolling over – which should be a tailwind for such commodity names. We have seen some of that, but gains have not been tremendous yet.
XME vs. SPY: Relative Uptrend Since Early July
Stockcharts.com
The Technical Take
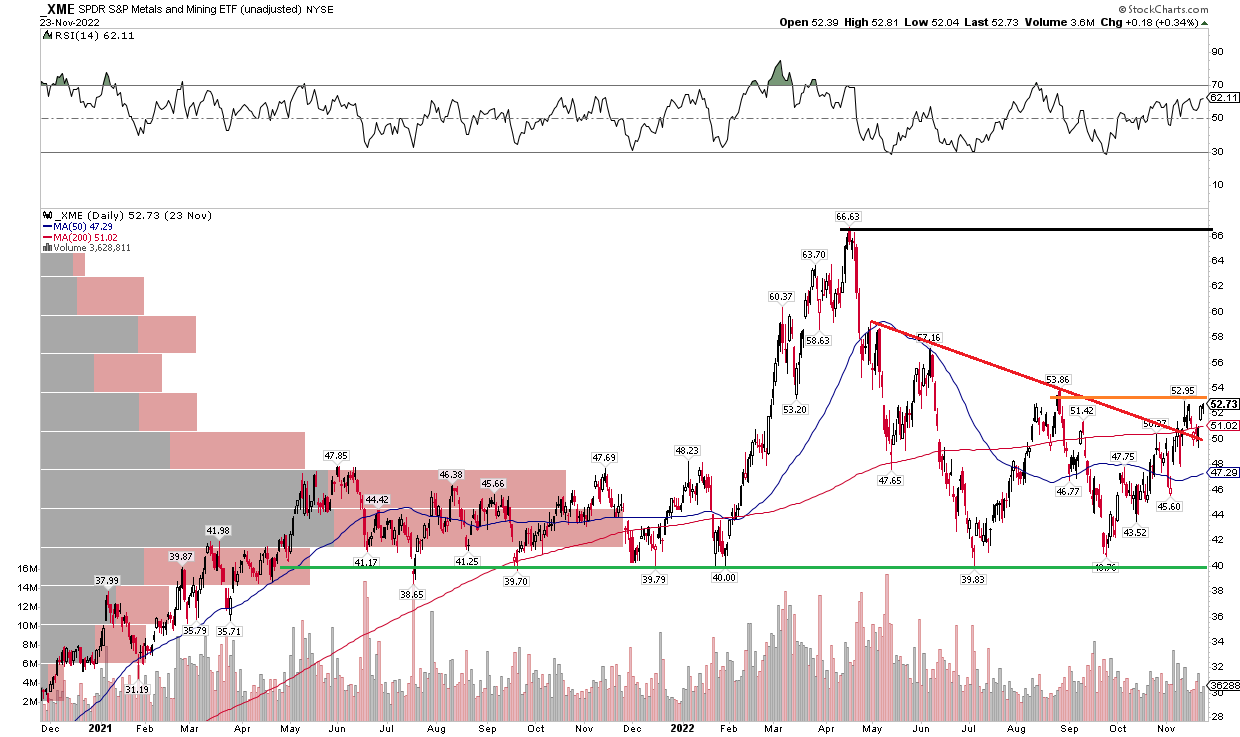
While the relative chart of XME against SPY looks good with a steady uptrend during the second half of 2022, the absolute chart is also constructive. Notice that the fund recently broke out from a downtrend dating back to May. On several occasions, XME held the pivotal $39 to $41 zone – that is a key spot for the bulls to monitor.
I would like to see the fund breakout above $54 – the chart has the hallmarks of putting in a bullish cup and handle pattern with the dual peaks from August and early November. A move above $54 could lead to an ultimate price objective right back near the April peak using the previous $13 range added on top of the $54 hypothetical price breakout point.
XME: Holds Critical Support, Breaking Out From Its Consolidation
Stockcharts.com
One more chart – we all know that most equity areas tend to do well during the November through April stretch. XME in particular, though, tends to see its greatest outperformance from now through early January, ultimately peaking against the S&P 500 in early June. So now could be a good time seasonally to scoop up shares.
XME: Strong Seasonal Stretch Ahead
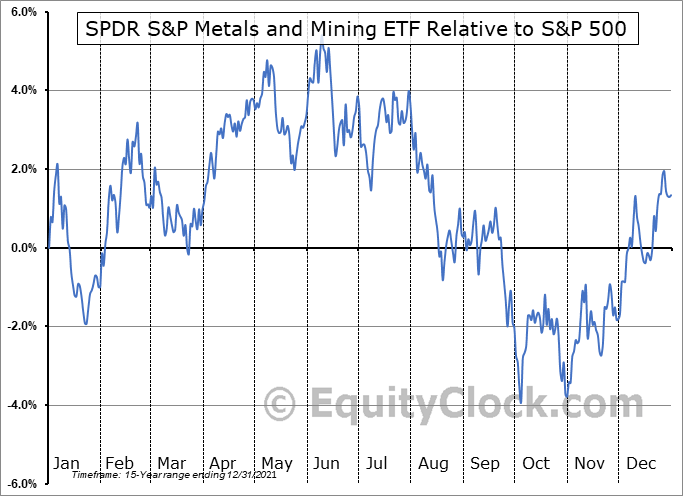
Equity Clock
Risks to the outlook include a weaker-than-expected global economy, a rising U.S. dollar, and general risk-off behavior.
The Bottom Line
I continue to assert that the valuation on XME is attractive with a forward P/E about half that of the broad market. Price action also remains constructive while bullish seasonality is about to be in full swing.
[ad_2]
Image and article originally from seekingalpha.com. Read the original article here.