
The CPI inflation rate ticked downward very slightly in July, from 9.0% to 8.5% per year. That is good, but 8.5% is still too darned high. And no, the just-passed “Inflation Reduction Act” does not get any credit for this small downtick in the annual inflation rate.
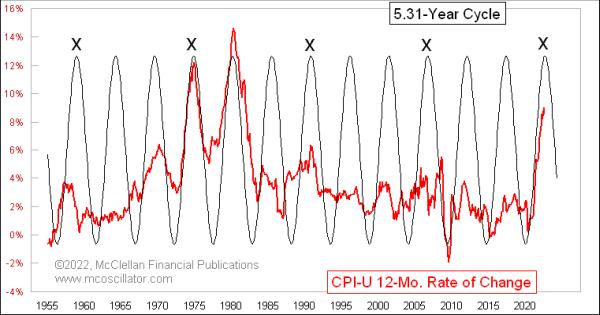
What does deserve some credit is the natural cycle in the inflation rate data depicted in this week’s chart. It shows a 5.31-year cycle, which is evident in the CPI data, and which has been working since shortly after World War II. One other interesting point about this cycle is that every third cycle seems to bring a somewhat more important peak for the inflation rate, as highlighted by the (X) designations on those cycle iterations.
It is worth noting that this 5.31-year cycle period did not work as well in the 1930s and 1940s due to governmental tinkering with pricing, such as the wartime price controls that were finally relaxed in 1946. Such governmental interference in commerce can disrupt the way that natural cycles are manifested. We still have governmental interference of various types, to be sure, but not quite to the same degree that the USA experienced in the 1930s and 1940s. That has allowed this cycle to be better revealed in recent decades.
When I speak of a “natural cycle,” I am borrowing a term from mechanical vibration theory, which holds that any solid body has a natural frequency of oscillation. If you take a 12″ wooden ruler and extend it off your desk, then give it a thwang, it will vibrate at a certain frequency. If you change how much of the ruler extends off the desk and repeat, it will vibrate at a new, different frequency. A plastic or metal ruler will vibrate differently than a wooden one, because of their material properties. But each has a natural frequency.
If you rev your car’s engine to 3000 RPM, you may feel a slight vibration through the chassis that is tied to that 3000 RPM input frequency. That does not mean it is a “natural” frequency of the solid body that is your car. You are setting an input frequency for the vibration that you are feeling based on the rotational speed of the engine. This is known in mechanical engineering as an “excitation frequency.” Anyone who has ever seen the video of the Tacoma Narrows Bridge destroying itself in 1940 knows about this principle.
A car will still have a bunch of natural frequencies. You may have noticed that your car seems smoother at 70 MPH than at 60 MPH, especially if towing a trailer. This is a manifestation of a natural frequency of the whole wheel/suspension system.
In the stock market and in the economy, there are both natural frequencies and artificial excitation frequencies. The four-year presidential election cycle is a great example of an excitation frequency, and it has demonstrable effects on stock prices. The schedule of FOMC meetings 8x per year is another possible example of an artificial excitation frequency.
When a demonstrable cycle period appears that one cannot tie to some manmade excitation frequency, then the supposition is that it is a “natural” frequency of the economic system. Something about the economy or the market results in an oscillation on a certain frequency which may not have a good outside explanation. Perhaps it is in how money flows. Perhaps it is in how human brains make decisions about surplus and scarcity. It is hard to know.
This 5.31-year frequency in the CPIs cycle seems to fall into that category as a natural cycle, because the 5.31-year period does not match any known excitation frequency related to human activity nor the economic calendar. So that makes it probably a natural frequency.
Looking outside of the conventional economic data, the 5.31-year period is somewhat close to half of the 11-year sunspot cycle. That cycle is actually 9-14 years, and the period can sometimes be irregular. Half-period harmonics are common in mechanical systems, and in stringed musical instruments. So to investigate that as a possible source for this cycle, I built this chart comparing the inflation rate against sunspot numbers:
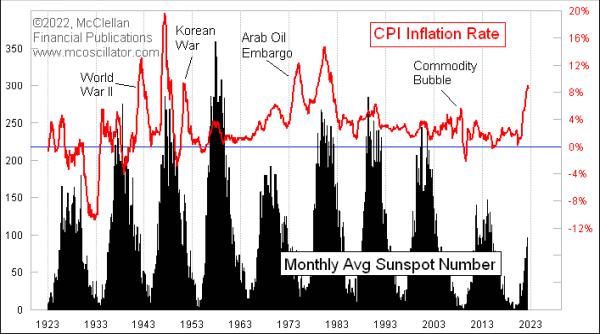
Using this broad view, there does seem to be a relationship between sunspots and the inflation rate. We see lots of instances when the peak of the sunspot cycle coincided with the peak of the inflation rate.
There have been spikes in the inflation rate not tied to the sunspot cycle, such as the spike during WWII, or the one caused by the Arab Oil Embargo of 1973-74. Those two examples did, interestingly, come at the halfway point of the sunspot cycle, fitting the half-period harmonic principle.
The current rise in inflation fits both the longstanding 5.31-year cycle and the upswing in the sunspot cycle. Solar researchers expect the current sunspot cycle rise to end in July 2025, which is 3 years from now. But the 5.31-year cycle says a top in the inflation rate is expected right now. That would mean seeing the inflation rate bottoming around 2025 just as the sunspot cycle is peaking. Sometimes cycles present us with conflicts that are hard to reconcile.
The point of the 5.31-year cycle that we can take away for right now is that the inflation rate should be falling for the next ~2.65 years. But that does not mean we get to zero percent inflation right away. The drops take a while to unfold. Inflation is likely with us for a while, and we have to get used to that idea.