One of the hardest parts of investing is changing your mind as the charts change, rather than waiting for the news and the economy to change. Before the CPI print, the market had been stalling sideways for almost two weeks. But after the CPI, the market started to rally higher again. The big difference this week, is we some sectors breaking through the 200 DMA, and industries that continued to be muted, broke out positively.
One of the biggest moves this week that I wouldn’t have expected is the move in the banks. Why? The narrative was terrible:
- Quantitative tightening coming up
- Inflation over 8%
- Fed tightening aggressively with another 0.75% happening mid September
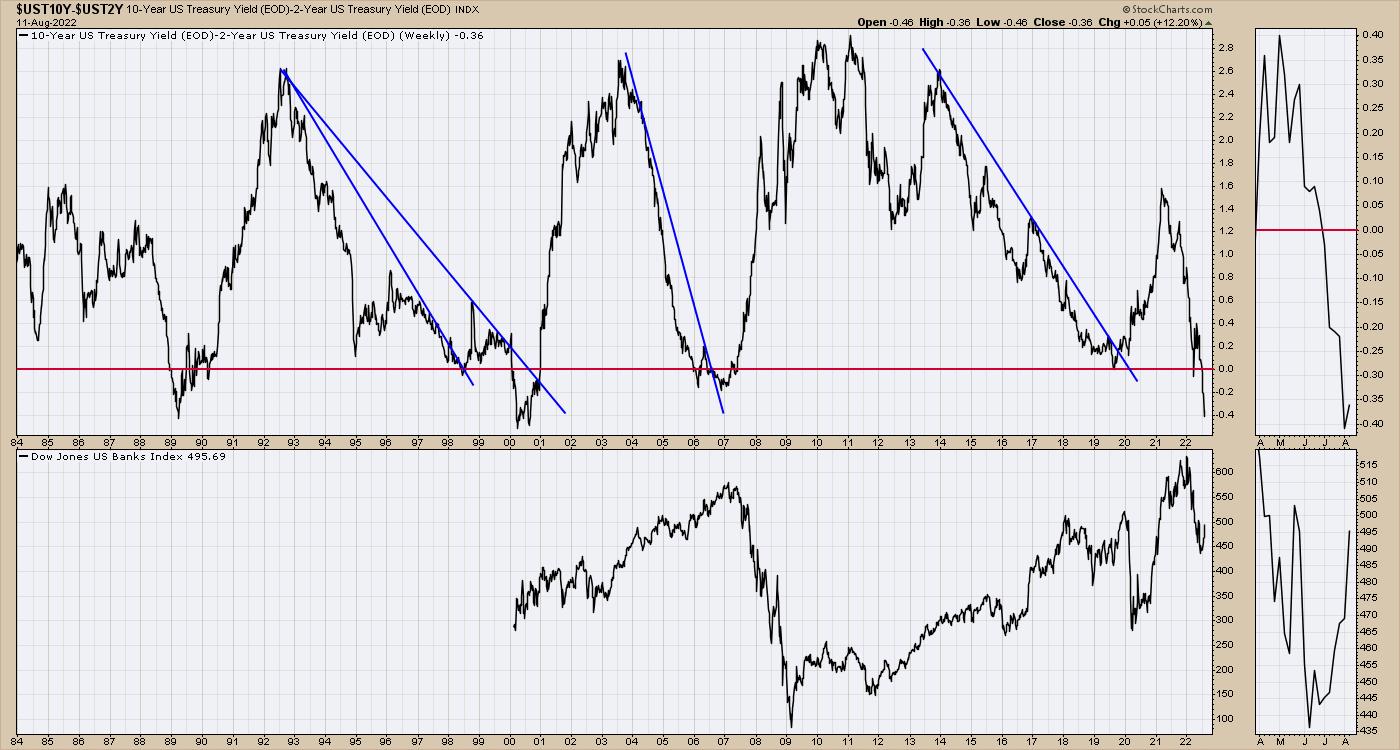
- Yield curves inverted with the 10-year at the lowest yield
- Supply chains a mess
- Energy shortages globally
- Food shortages for large parts of the world
- war
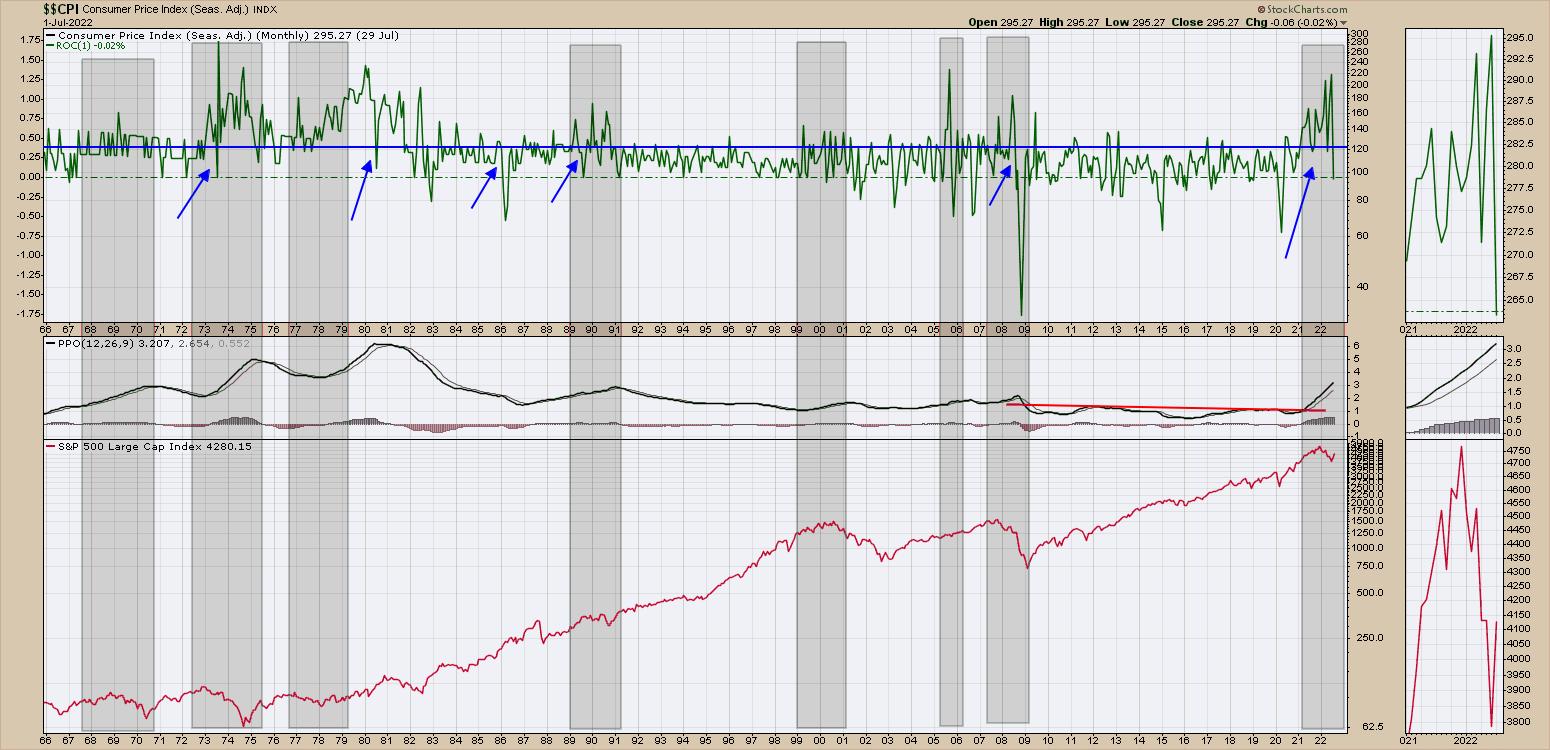
That narrative doesn’t describe what is going on in the investing rally. The chart below is the rate of change for the consumer price index on the top panel. I added some blue arrows :
- where the PPO momentum for CPI was rising
- where ROC readings had been meaningfully higher than the blue dashed line for a while.
- we had a sudden drop in the rate of change
We could sort the signals various ways but it seems to be a mixed bag for $SPX returns.
When I think about the banks, we can ponder if the yield spread starts going from getting worse to getting better, will the banks start to rally?
I don’t know the narrative, but the KBE shot up this week. It was above the 20 Week Moving Average (WMA) last week and this week it moved above the 40 WMA. I circled the last time that happened on the chart. It was an epic run in the bank names.
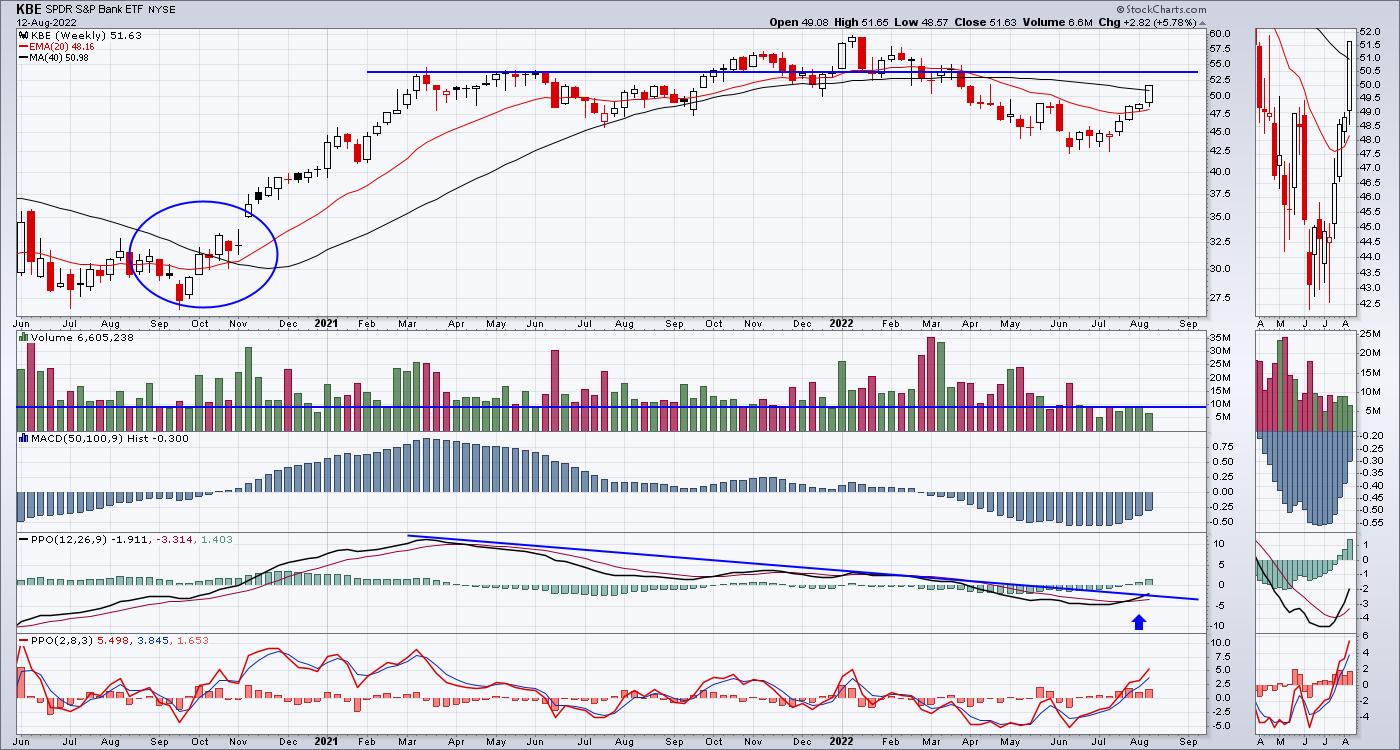
When banks and industrials are moving above the 40 WMA, something is changing. Better to ride the trend than question it.