
[ad_1]
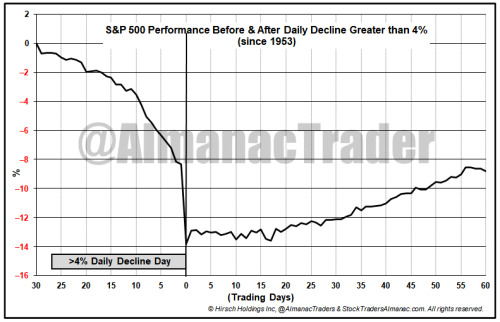
Today’s hotter than anticipated CPI report was the bad that triggered the day’s ugly across-the-board declines. Surging Treasury bond yields hit NASDAQ the hardest, off 5.16% today. Tech-heavy S&P 500 was down 4.32% while DJIA was off 3.94%. Since 1950, S&P 500 has declined 4% or more in a single day 53 times before today. In those previous 53 occurrences, on the next trading day S&P 500 was higher 35 times and lower 18 with an average gain of 1.08% on all days. Based upon historical performance, the odds of a gain tomorrow are 66.04%.
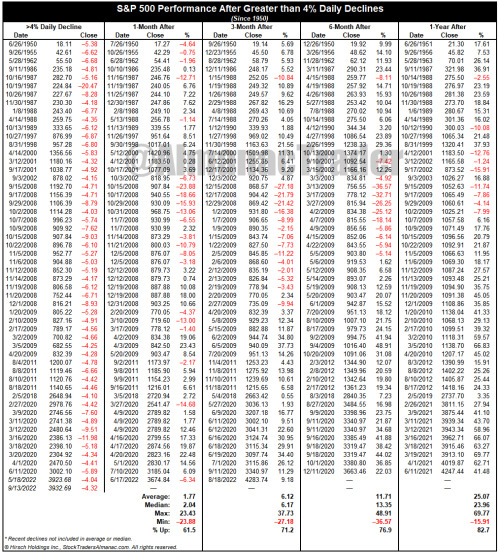
However, the line chart of the 30 trading days before and 60 trading days after the last 53 greater than 4% drops does not suggest any significant advance in the near-term as S&P 500 only managed a modest recover, on average over the next 20-25 trading days (a typical month is generally 21 trading days). But the following table does showcase solid gains in the majority of occurrences when looking forward the next 3-, 6- and 12-months. S&P 500 was higher 82.7% of the time one year after a greater than 4% daily decline with an average gain over 25%.
Click here for full size table…
[ad_2]
Image and article originally from jeffhirsch.tumblr.com. Read the original article here.