
[ad_1]
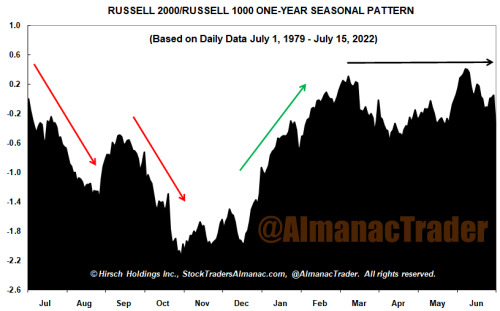
In the above chart, 43 years of daily data for the Russell 2000 index of smaller companies are divided by the Russell 1000 index of largest companies, and then compressed into a single year to show an idealized yearly pattern. When the graph is descending, large caps are outperforming smaller companies; when the graph is rising, smaller companies are moving up faster than their larger brethren. Small-caps have historically peaked versus large-caps in late-May to early June and tend to underperform until sometime in the fourth quarter.
Compared to S&P 500 or Russell 1000, the Russell 2000 has modestly underperformed this year. As of Friday, July 15 close Russell 2000 was down 22.31% year-to-date compared to –18.95% for S&P 500 and –19.93% by Russell 1000. Despite declining less today, Russell 2000 is likely to continue to underperform through the remainder of the third quarter before reversing course sometime in Q4.
[ad_2]
Image and article originally from jeffhirsch.tumblr.com. Read the original article here.