
[ad_1]
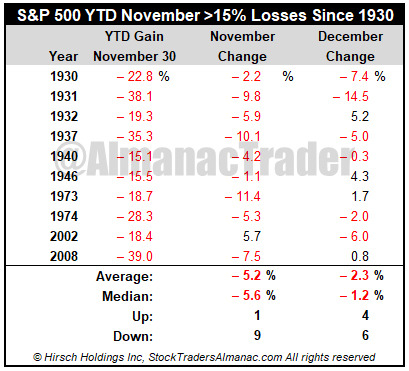
There was a stat floating around the internet and business news channels this week that stated when the S&P 500 was down 15% or more year-to-date (YTD) on November 30 December was down >2% on average. We ran the numbers yesterday before the big rally on Fed Chair Powell’s “makes sense to moderate the pace of our rate increases” comments yesterday at the Brookings Institute.
What we found was that most of the carnage after November YTD losses > 15% occurred in the Great Depression years and since WWII December has performed much better after a down >15% YTD November. During the Depression after these November YTD >15% losses December was down 3 of 4 with an average loss of -5.4%. In the six years since 1939 with these November YTD >15% losses December was up 3, down 3 with an average loss of -0.3%.
But with the big 3.1% gain in the S&P 500 on November 30, the YTD loss receded above the -15% mark to -14.4% on the heels of a 5.4% gain for the month, which is also a 14.1 percent rally off the October 12 low. And this marks the first back-to-back monthly gains of over 5% each month since August 2020, the ones before that were in March-May 2009. It’s the 14th such occurrence since 1950. The previous 13 all occurred in bull markets.
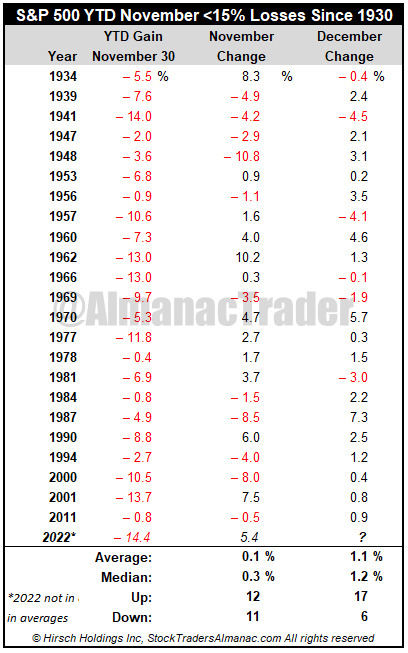
Now, when the S&P 500 is down YTD November less than 15%, December’s performance is not so bad at all, just a tad below the average 1.6% to 1.1%, up 17 of 23 or 74% of the time. We still expect some chop as the bull market finds its footing, but we remain bullish and anticipate the yearend rally to continue to climb the proverbial “wall of worry” and for the Santa Claus Rally to come to town.
[ad_2]
Image and article originally from jeffhirsch.tumblr.com. Read the original article here.