[ad_1]
S&P 500 News and Analysis
- Big US banks prepare for a challenging 2023 ahead of fourth quarter earnings report
- S&P 500 technical considerations: Lack of bullish follow through poses a challenge for US equities as the long-term downtrend dictates direction into 2023
- The analysis in this article makes use of chart patterns and key support and resistance levels. For more information visit our comprehensive education library
Recommended by Richard Snow
What do our analysts foresee in equities for Q1
Big US Banks Prepare for a Challenging 2023 Ahead of Fourth Quarter Earnings Report
Four of the main lenders in the US are expected to report their financial results for the fourth quarter of 2022 on Friday and analysts are expecting a tougher business climate for the industry in 2023 as rates are expected to rise further.
JPMorgan Chase & Co, Bank of America Corp, Citigroup Inc and Wells Fargo & Co will report earnings on Friday with Goldman Sachs and Morgan Stanley due on Monday.
While it is true that banks earn more on loaned funds in periods of higher interest rates, they also tend to increase write offs on bad loans as economic and monetary conditions tighten further.
Net income for the fourth quarter is expected to decline across the board when compared to a year earlier, as shown in the graphic below:
US Banks Readying up for Lower Profit Reports
Source: Refinitiv, prepared by Richard Snow
Unsurprisingly, US equities have been at the mercy of recent data prints as the market re-evaluates the timing of the Fed pause. Encouraging jobs data in the middle of last week was more than overcome by the news that the services sector (largest sector of the US economy) entered contraction on Friday. This along with lower average hourly earnings helped promote the idea of the Fed hiking at a slower pace than initially envisioned as the incredibly tight labor markets reveals signs of strain – spurring risk assets in the process.
S&P 500 Technical Considerations
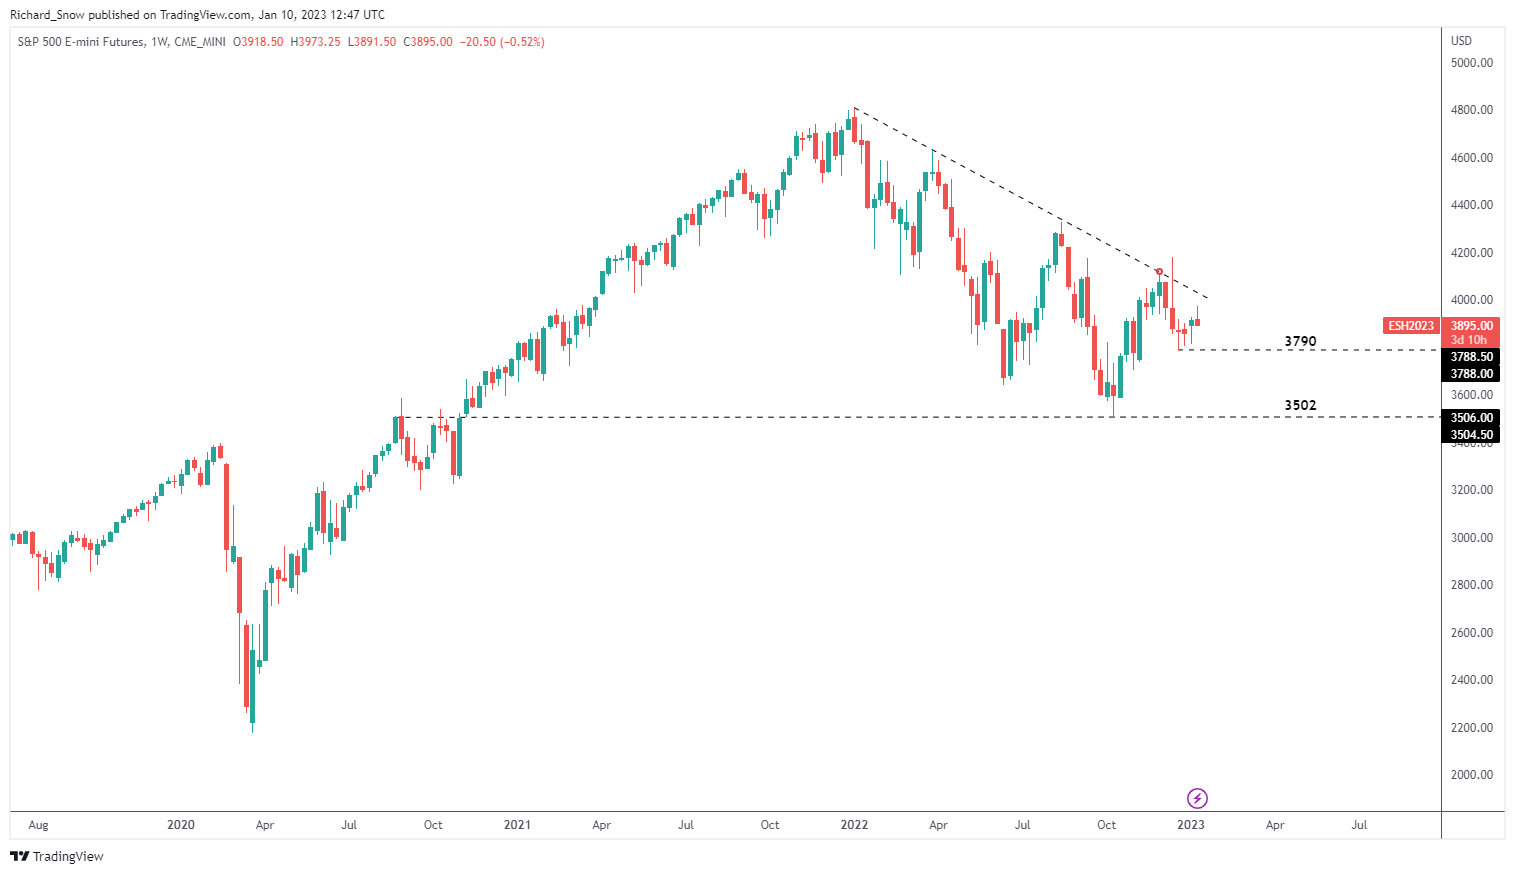
The weekly S&P futures chart shows the longer-term downtrend remains intact even after the spike high. The longer that remains the case the more worrying it becomes for US equity markets. The technical landscape matches the general outlook that 2023 is shaping up to usher in a sizeable slowdown or even recession.
S&P 500 Futures Weekly Chart (ES1!)
Source: TradingView, prepared by Richard Snow
Recommended by Richard Snow
Building Confidence in Trading
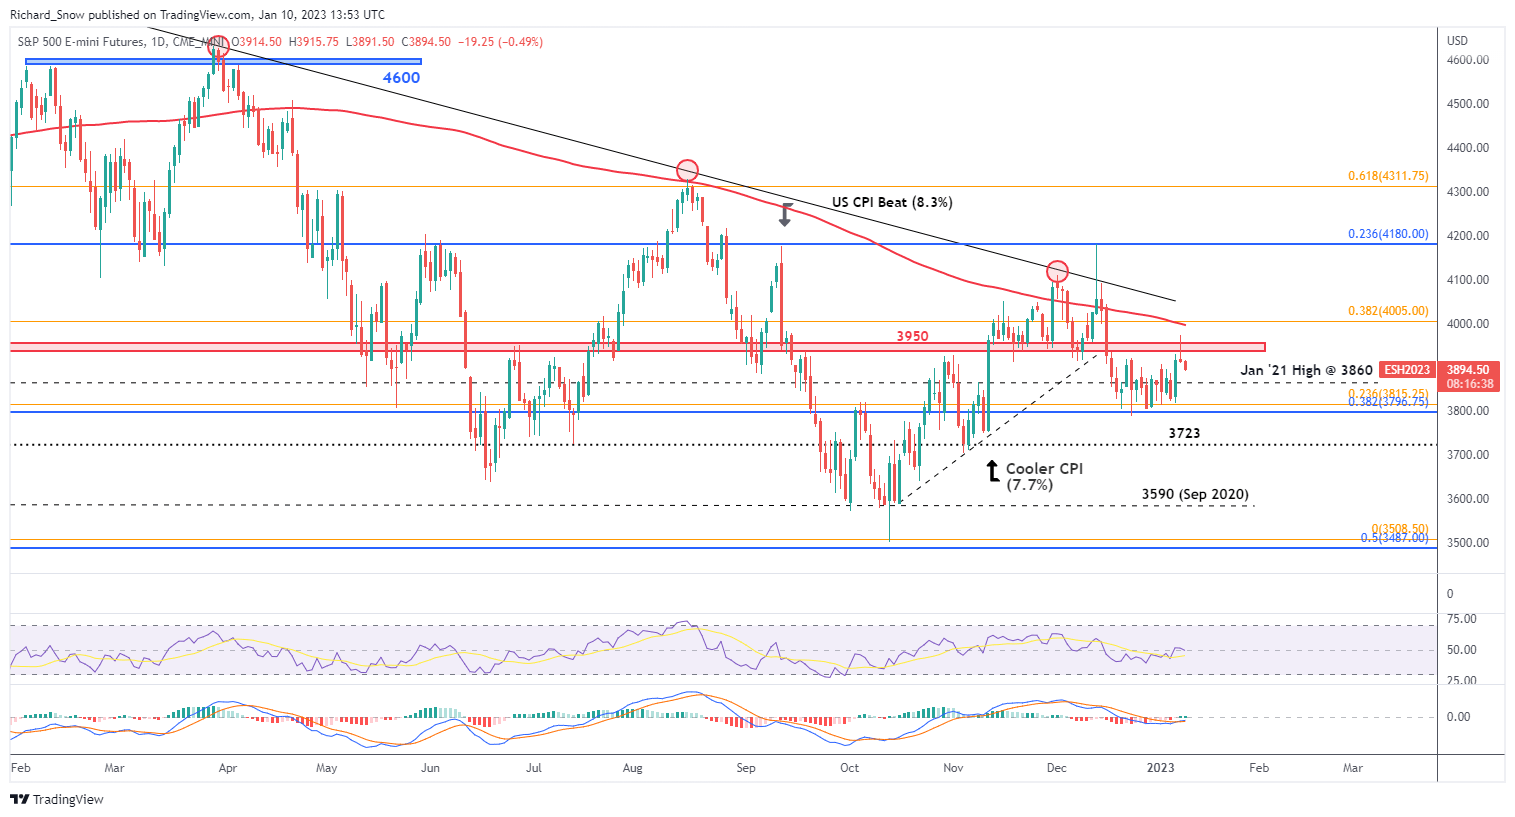
The daily chart helps to reinforce the lack of follow through in bullish momentum on the back of Friday’s data and the market’s downward revision in the expected terminal rate – which bid equities higher.
The zone of resistance around that 3950 area continues to pose a challenge for bulls as yesterday’s price action clawed back gains and managed to end lower on the day. Further resistance appears via the 200-day simple moving average, placing more pressure on equity valuations.
In the event prices continue lower, the underside of the recent range or channel comes back into focus at the 3815 and 3796 levels which correspond with the 23.6% Fibonacci retracement of the 2022 major move and the 38.2% Fib retracement of the large 2020 to 2022 move.
S&P 500 Futures Daily Chart (ES1!)
Source: TradingView, prepared by Richard Snow
— Written by Richard Snow for DailyFX.com
Contact and follow Richard on Twitter: @RichardSnowFX
[ad_2]
Image and article originally from www.dailyfx.com. Read the original article here.


