

[ad_1]
tum3123
Emerging Market stocks have been under pressure over the past few months due largely to the surging U.S. dollar. A combination of U.S. rate hikes, weakness in commodity prices, and deteriorating China-Taiwan relations, have supported the greenback and undermined EM stocks significantly. However, selling pressure appears to have been exhausted, with EM stocks holding up well on Friday despite renewed dollar strength due to the strong U.S. jobs report. The MSCI Emerging Markets index, which the iShares MSCI Emerging Markets ETF (NYSEARCA:EEM) tracks, is now trading at a near-record discount to developed market stocks, with long-term real return prospects up at around 5%. Now is a great opportunity for investors to shift out of developed stocks and into emerging markets.
The EEM ETF
The EEM offers a reasonably well diversified option for those looking for exposure to emerging markets. The index is heavily weighted towards China/Hong Kong, which make up around 30% of the index. Taiwan, Korea, and India each also command over a 10% weighting in the index. From a sector perspective, Financials and Technology stocks make up around 20% each, and commodity stocks (Energy and Materials) comprise a combined 13%, which is significantly higher than most developed market indices. The top 10 stocks combined make up 23% of the total index, meaning investors have relatively little exposure to any single stock. The main difference between the EEM and the Vanguard FTSE EM ETF (VWO) is that the latter excluded Korean stocks. The EEM’s main drawback is it’s high expense ratio at 0.7%, which compares to just 0.1% for the VWO.
Strong Dollar Pressure Is Easing
The EEM’s weakness since its peak in February 2021 has occurred in lockstep with the strengthening dollar. EM stocks have always been highly sensitive to the greenback, but the correlation has strengthened over recent years as the chart below shows, suggesting that any meaningful recovery in the EEM will likely only occur if we see significant dollar weakness.
DXY (inverted) Vs EEM (Bloomberg)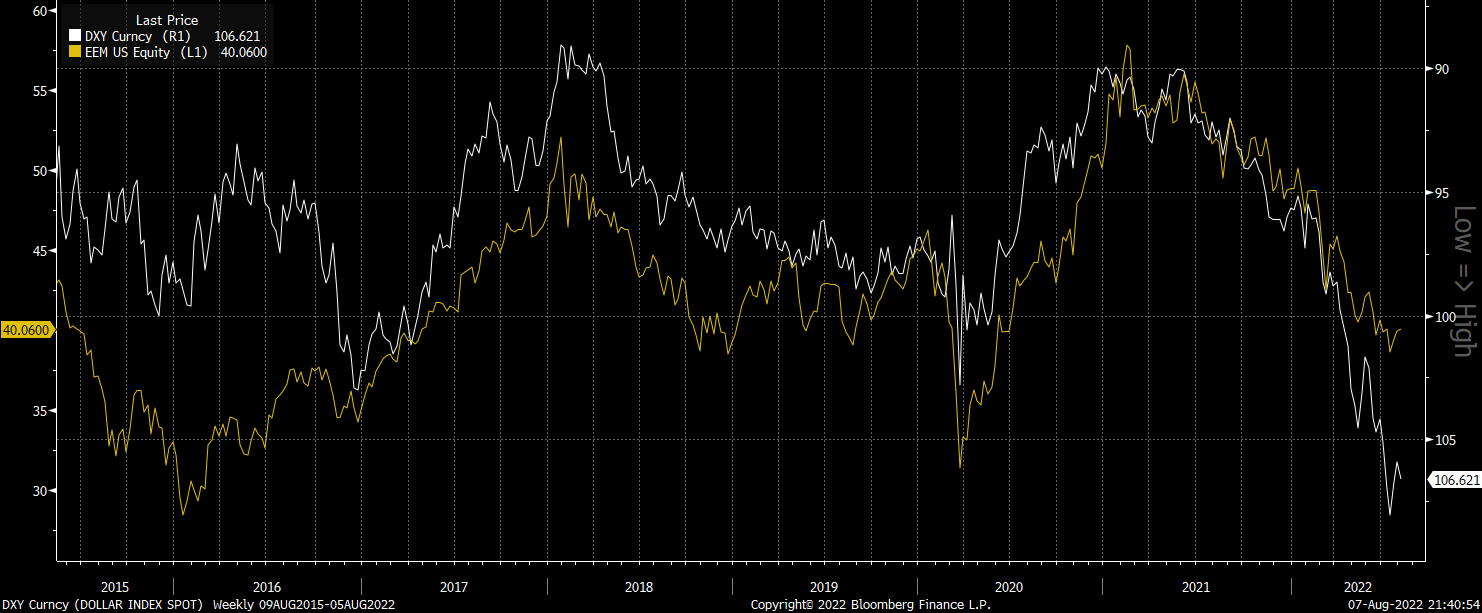
The dollar is now significantly overvalued in real effective terms, which suggests that long-term weakness can be expected. The dollar’s real effective exchange rate is now back to levels not seen since 2002, following which the currency embarked on a multi-year bear market. Furthermore, real bond yields (the spread between nominal bond yields and long-term inflation expectations) appear to have peaked as investors increasingly anticipate the Fed to prioritise growth over inflation (for more context see ‘U.S. Bonds: Backing Up The Truck’). These two factors suggest the dollar’s rally is likely to come to an end sooner rather than later.
USD Real Effective Exchange Rate (JPMorgan, Bloomberg)
We have also begun to see signs that selling pressure in the EEM is being exhausted as the ETF largely shrugged off the dollar’s last leg higher, as well as the knee-jerk rally on the back of Friday’s strong payrolls figures. The EEM looks to have consolidated its gains above down trendline resistance which may indicate a trend change.
EEM ETF (Bloomberg)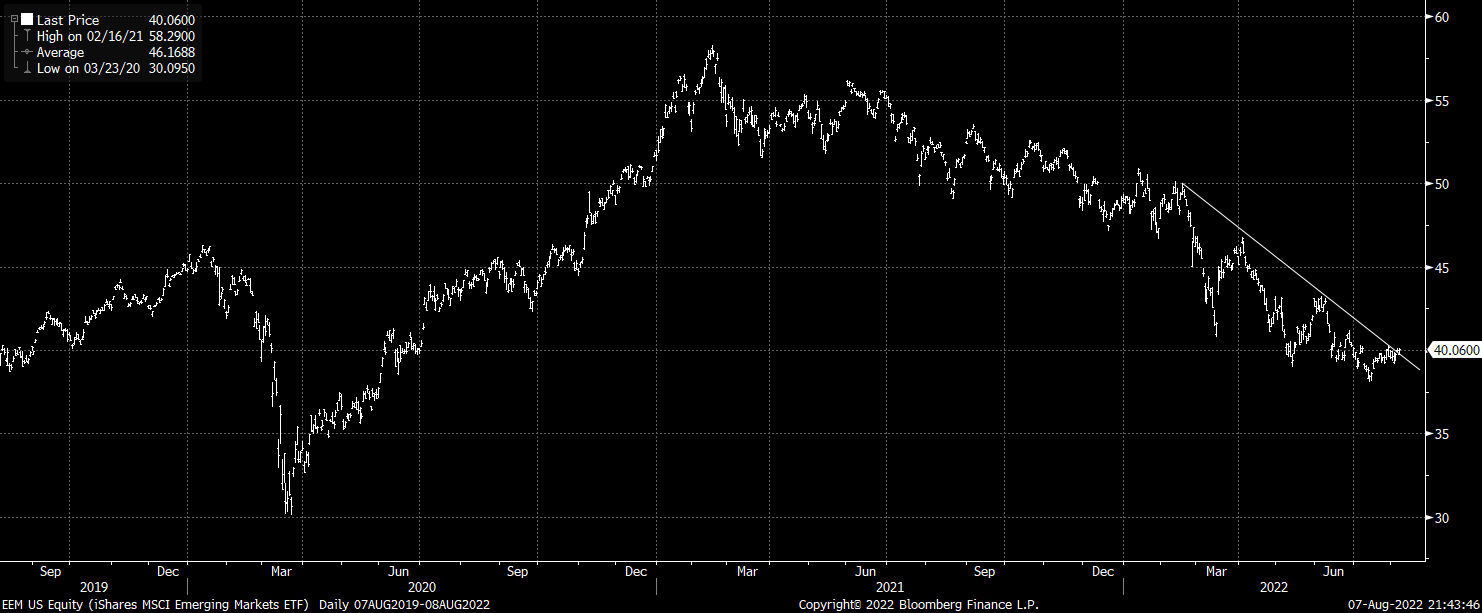
Valuation Discount Back At Extremes
From a valuation perspective the MSCI Emerging Markets Index is now undervalued from a historical perspective, and particularly undervalued relative to developed market stocks. At a price/earnings ratio of 11.1x, the EEM is as cheap as it was at the Covid crash lows, and trades at a 36% discount to the MSCI world.
MSCI Emerging Markets P/E Ratio (Bloomberg)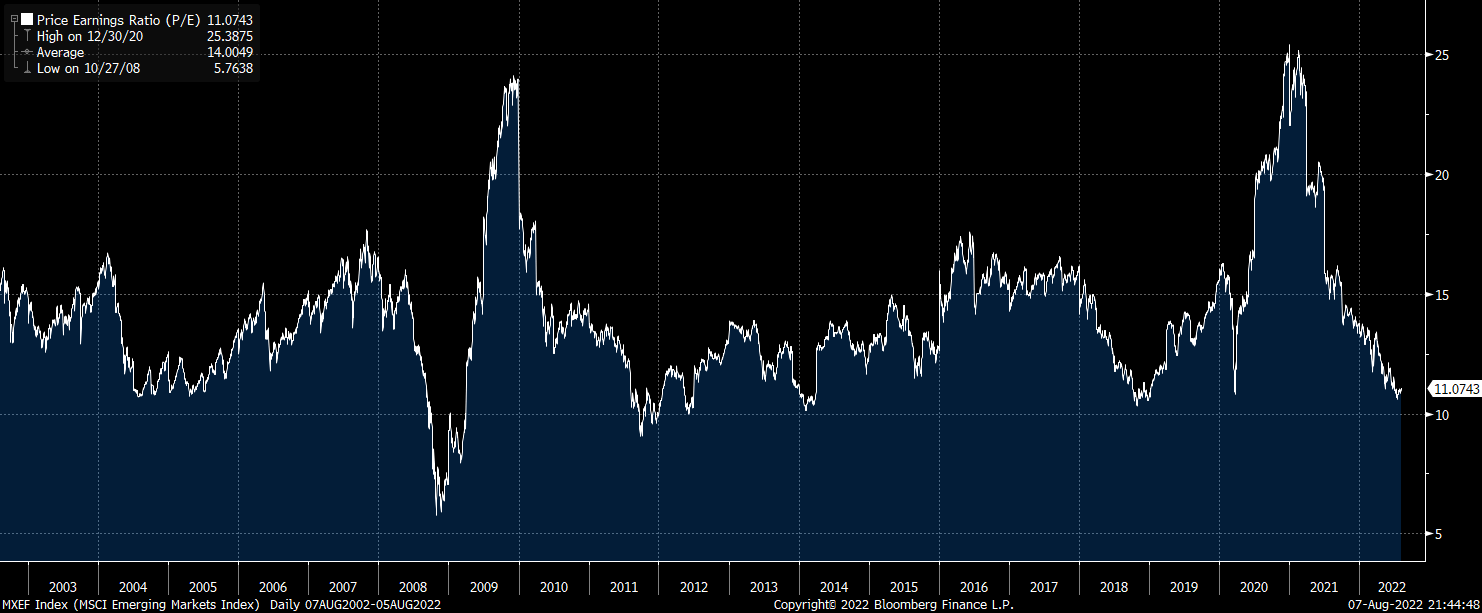
While elevated profit margins may overstate the extent to which the EEM is undervalued in absolute terms, its discount to the MSCI World is elevated on every metric as the table below shows. On a price/book value basis, EM stocks are now trading at just over half of their developed market counterparts.
|
Price/Earnings |
EV/EBITDA |
Price/Sales |
Price/Book Value |
Dividend Yield |
|
|
EEM |
11.1 |
8.1 |
1.2 |
1.4 |
3.1 |
|
% Discount to Long-Term Average |
21 |
0 |
7 |
17 |
20 |
|
% Discount to MSCI World |
36 |
30 |
39 |
49 |
33 |
Source: Bloomberg
It should be noted that the EEM’s valuation discount relative to the developed world almost entirely reflects the still-elevated valuation levels seen in U.S. stocks. As the chart below shows, the EEM’s price/book ratio is roughly on par with that of the MSCI World ex-U.S. index, both of which are deeply discounted relative to the U.S.
MSCI EM, MSCI World Ex-US, And MSCI US (P/B Ratios) (Bloomberg)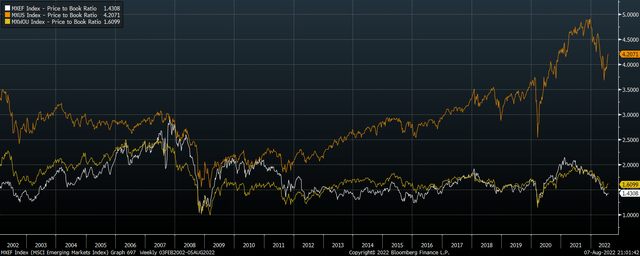
These stark valuation differences should manifest in significant outperformance of EM stocks over the coming years. According to value investors GMO, as of June 30 emerging market stocks were priced to outperform U.S. large cap stocks by 5.7% annually over the next 7 years. Since then, the outperformance of U.S. stocks has continued, suggesting that EM should be expected to outperform by around 6% annually.
7-Year Real Return Forecast (GMO)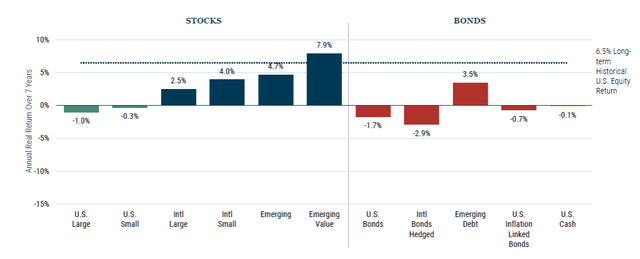
Summary
Emerging Market stocks appear to be turning a corner following 18 months of weakness at the hands of the strengthening dollar. The EEM is showing signs of bottoming out as the dollar faces headwinds from falling long-term real bond yields. Valuations imply that EM stocks should return around 5% annually in real terms over the long term, which is likely to be significantly higher than their developed market counterparts. That said, the EEM’s high expense ratio will eat into returns.
[ad_2]
Image and article originally from seekingalpha.com. Read the original article here.