

[ad_1]
DieterMeyrl
Gold mining stocks soared earlier this year amid geopolitical tensions and rising global inflation. The popular (and often infamous) VanEck Vectors Gold Miners ETF (GDX) climbed from under $29 in late January to above $41 by its early second-quarter high. Over the last four months, however, the fund is down a whopping 34%. The three-month ETF performance heat map below illustrates that the group of misfit gold miners has underperformed most other areas of the market.
Three-Month ETF Performance Heat Map: GDX Red
Finviz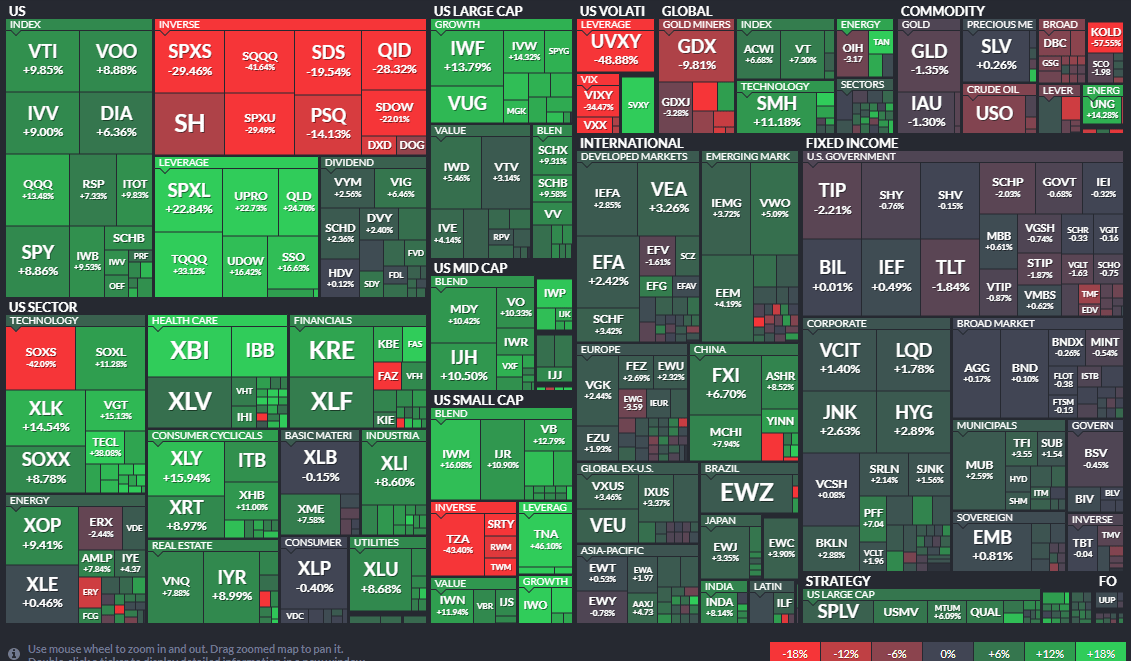
Q2 earnings season did few favors for GDX. The biggest holding in GDX, Newmont Corporation (NEM), issued a disappointing quarterly report as higher costs dinged its profit outlook. The gold mining ETF bottomed out under $25 on NEM’s July 25 earnings release.
Gold Fields Limited (NYSE:GFI) is the seventh-largest holding in the GDX fund. At a 4% weight, it certainly influences how the group performs. According to the company website, GFI is the seventh largest (by production) gold producer in the world, with attributable annualized production of 2.1 million ounces (gold equivalent) from seven operating mines in Australia, Ghana, Peru, and South Africa. The Group also has two active projects in its portfolio, Gruyere (50:50 joint venture) in Western Australia, which is in the construction phase and Salares Norte in Chile, currently in the feasibility phase.
The South Africa-based $8.4 billion market cap Metals & Mining company in the Materials sector trades at 10.5 time trailing 12-month earnings and has a 2.7% dividend yield, according to The Wall Street Journal. Analysts at Bank of America Global Research see profits increasing through 2024 for the beaten-down mining stock. BofA also forecasts a higher dividend yield over time. With a low P/E multiple and a depressed EV/EBITDA, the stock appears cheap. Also consider that free cash flow is expected to be strong in the years ahead.
GFI: Earnings, Dividend, Valuation Forecasts
BofA Global Research
GFI’s corporate event calendar shows a semiannual confirmed earnings date of Thursday, August 25, BMO for 1H22 results. Another volatility catalyst might take place on September 18-21, when the firm’s management team is expected to speak at the Gold Forum Americas 2022 conference. Interim production data from Gold Fields is slated for November 9, 2022, according to Wall Street Horizon.
Gold Fields Corporate Event Calendar: Earnings On Tap
Wall Street Horizon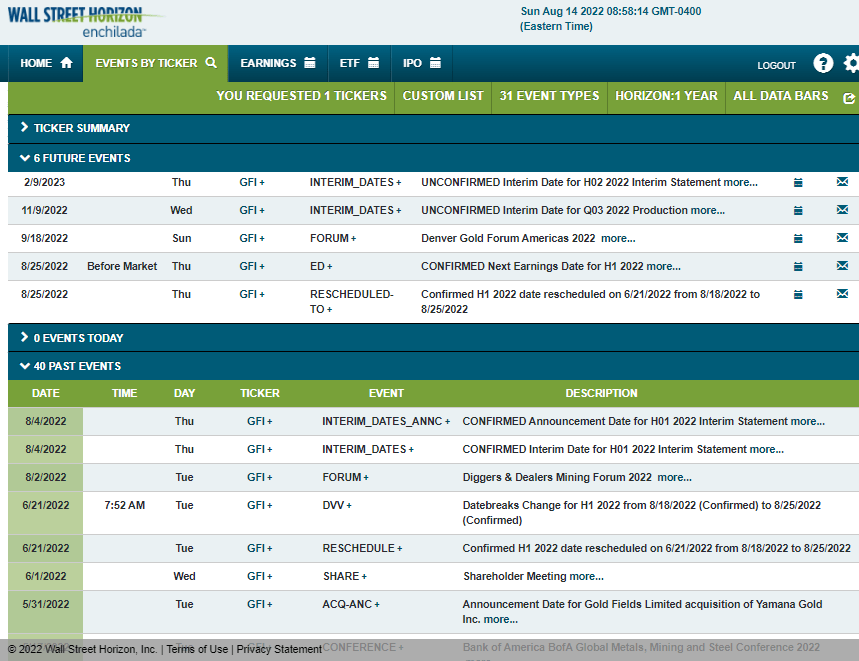
ORATS data show traders expecting a 6.1% share price change following H1 earnings next week.
Options Pricing Ahead Of Earnings
ORATS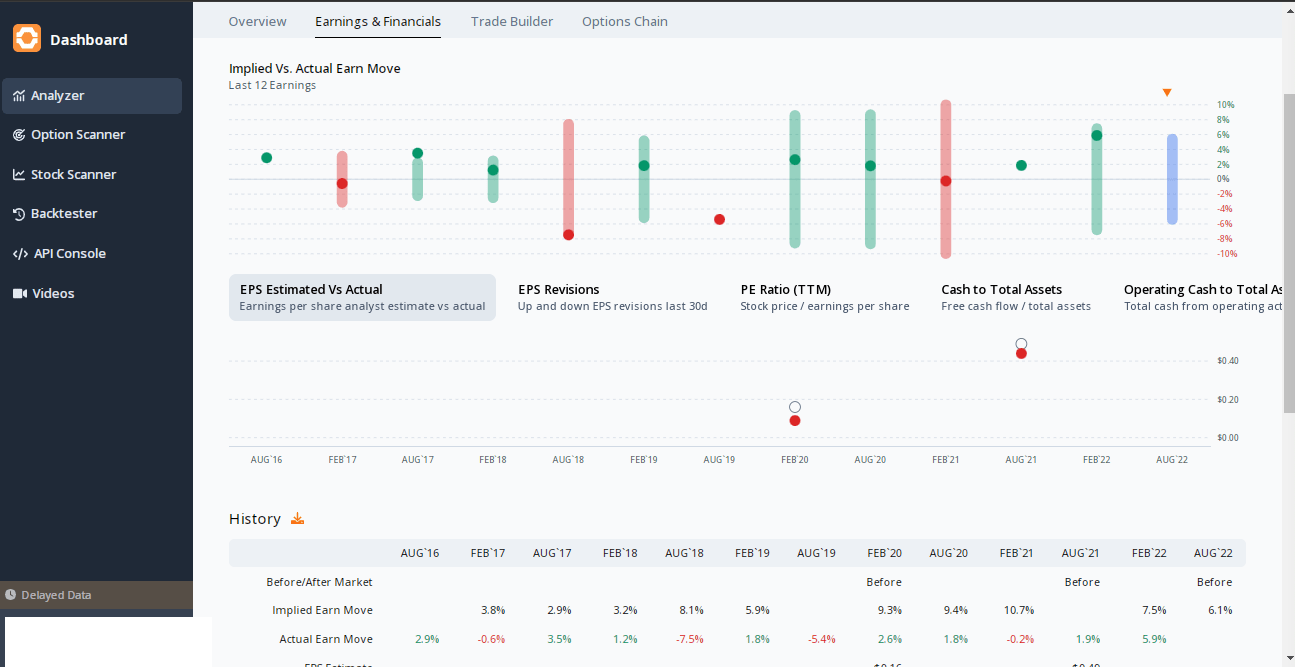
The Technical Take
With a compelling valuation and a few important dates on the calendar upcoming, what does the chart say about GFI shares? I see upside potential. Buyers have historically come about in the $7.75 to $8.50 range, and the recent bottoming formation off the late July low lends credence to the narrative that higher prices are in the offing.
I see resistance near $12. That was about the high from May last year and sellers emerged once again in late May and early June 2022 at that level, which coincided with a big gap-down in price. I think GFI rallies from here but may top out in that $11.80 to $12.50 range.
GFI: Rallying Off Support
StockCharts
The Bottom Line
Gold Fields is near a support zone and the chart’s rounded bottom pattern looks bullish. Fundamentally, shares trade at a cheap P/E and EPS growth is seen as strong over the coming two years. There are a few events over the coming three months that could spark some buying activity.
[ad_2]
Image and article originally from seekingalpha.com. Read the original article here.