After a pretty dismal stock performance in 2022, investors are looking forward to some signs of optimism in the first trading week of the new year. Alas, the first two days didn’t bring much hope. Fed minutes indicate that inflation is still high, and that means more interest rate hikes in 2023. The ISM data shows that manufacturing is contracting. Big-name stocks such as Tesla (TSLA) and Apple (AAPL) saw significant price declines.
So, where’s the silver, er gold, lining? Well, it may just be in gold stocks. When equities aren’t looking that great, investors are inclined to invest in risk-off assets such as gold. So, even if you just invest in stocks, it’s a good idea to keep an eye on other asset classes as well.
A good starting point on the StockCharts platform is Your Dashboard. Using the Market Overview panel, you can quickly skim equities, bonds, commodities, and cryptocurrencies. If you see that gold is performing well, you can either select Gold (GLD) or pull up a chart of gold futures ($GOLD).

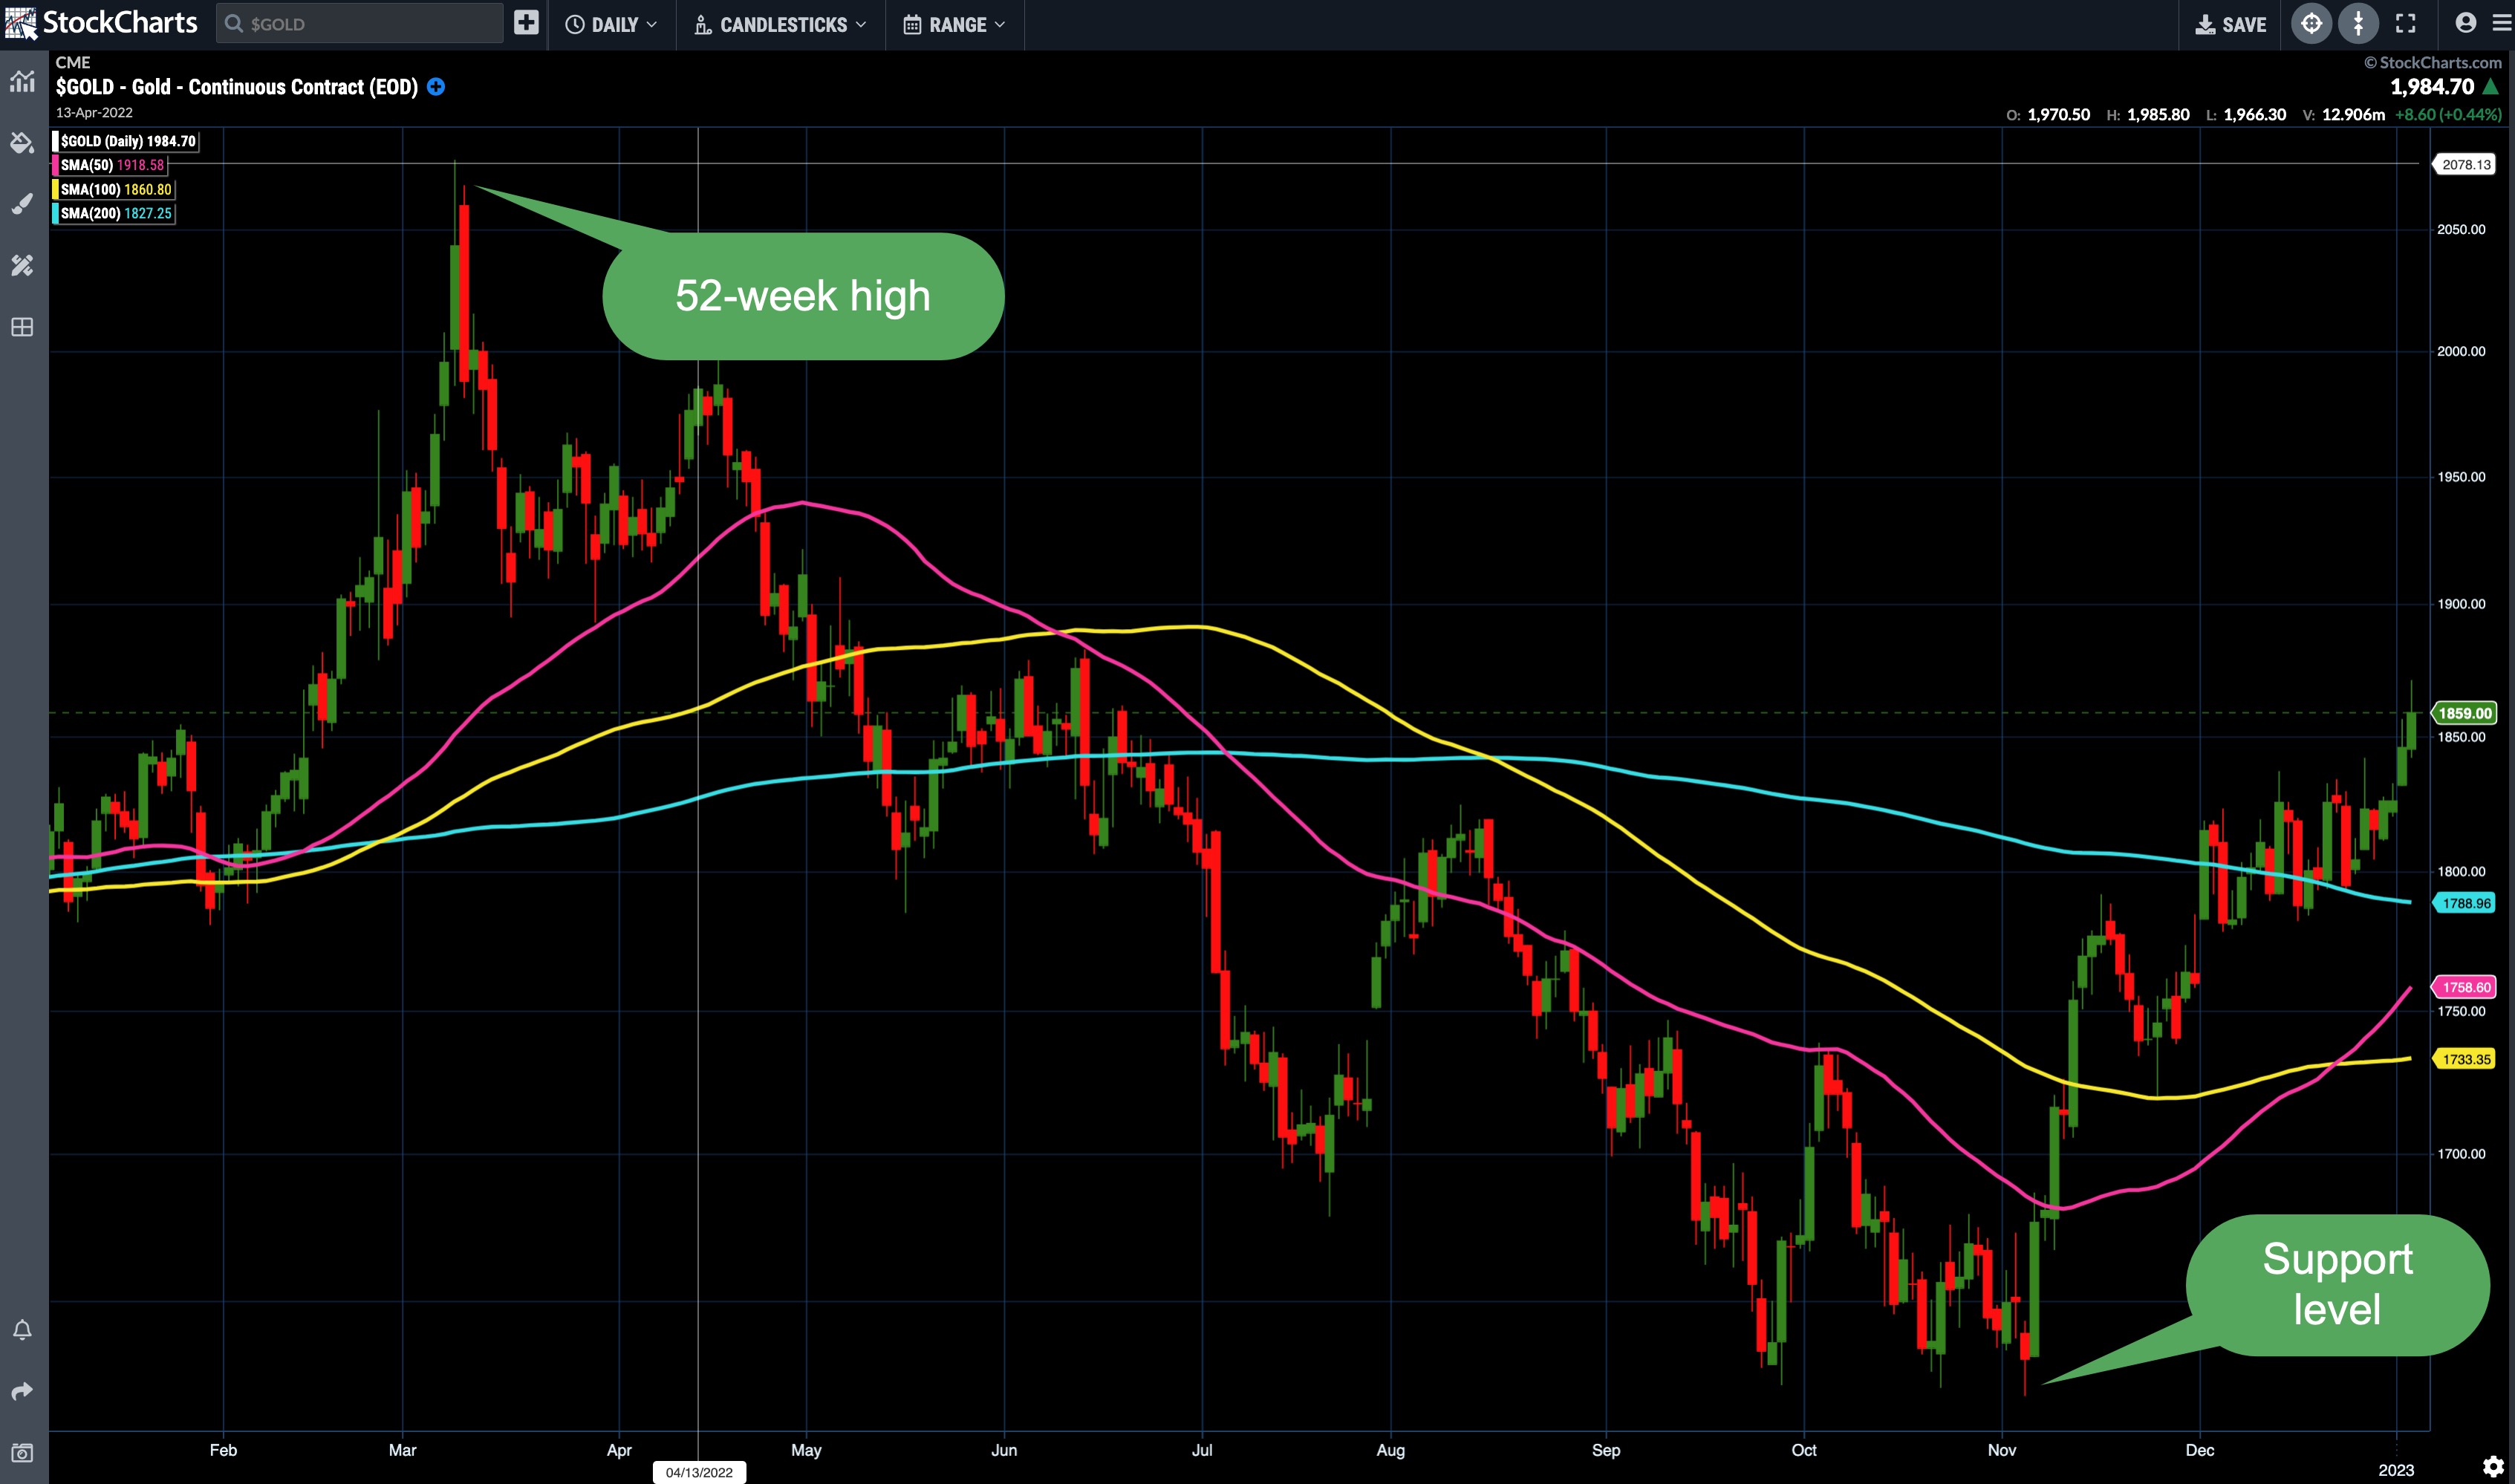
From a technical perspective, gold futures are looking ripe for a rally.
- Since bouncing off its 1618 support level, gold has moved higher, with higher highs and higher lows.
- Gold is trading above its 50-, 100-, and 200-day moving averages.
- Gold reached a 52-week high of 2078.80 per ounce. That means there’s potential for further upside movement.
Trading gold futures may not be your thing, but you can take advantage of the price movement of gold futures by investing in gold-related exchange-traded funds (ETFs) or stocks. The SPDR Gold Shares ETF (GLD) is a great proxy for following gold price movement. You may also want to analyze other gold stocks, such as Newmont Corp (NEM), Rio Tinto PLC (RIO), and Southern Copper Corp. (SCCO).
In the Member Tools section of Your Dashboard, scroll down to Summary Pages and select Symbol Summary. Enter the symbol of the stock or ETF you’re considering. This is your gateway to all kinds of analytic tools. You can view charts, analyze technical indicators or company fundamentals, and identify the SCTR rank, among other things.
The markets are always changing, and if one asset class isn’t working for you there are other opportunities. The best way to be informed is to always have a big picture view of the market.
Happy charting!


