
[ad_1]
leonello/iStock via Getty Images
Solactive Global Lithium Index
Summary
Global X Lithium & Battery Tech ETF (NYSEARCA:LIT) has underperformed the price of lithium, or LCE, as well as key lithium producers. This is due to the simple fact that the ETF invests 69% of assets in EV battery stocks that do not benefit from higher LCE prices. A close examination of its portfolio and benchmark leads me to believe that LIT is a poor option for those seeking exposure to EV metal raw material growth.
The ETF has 69% of NAV in EV battery and component manufacturers mostly in Asia.
LIT NAV breakdown by product and country (Created by author with data from LIT and Capital IQ)
Performance vs LCE
Performance has been very good since the YE2020 pandemic lows, the ETF is up 200%, led by Tesla (TSLA) and BYD (OTCPK:BYDDF). However, on a 12 month basis the ETF is down 11% while LCE prices have jumped from US$6.5k/ton to US$50k/ton. The problem is that LIT’s portfolio only has a 31% exposure to lithium stocks and is structurally unable to capture EV metal demand and price increases.
In my view LIT lacks higher weights in Chilean and Australian Lithium producers such as Soquimich (SQM), Pilbara (OTCPK:PILBF), Allkem (OTCPK:OROCF) and Mineral Resources (OTCPK:MALRF). The chart below highlights the LIT under performance vs. this group.
LIT 12 month performance vs key lithium stock. (Created by author with data from Capital IQ)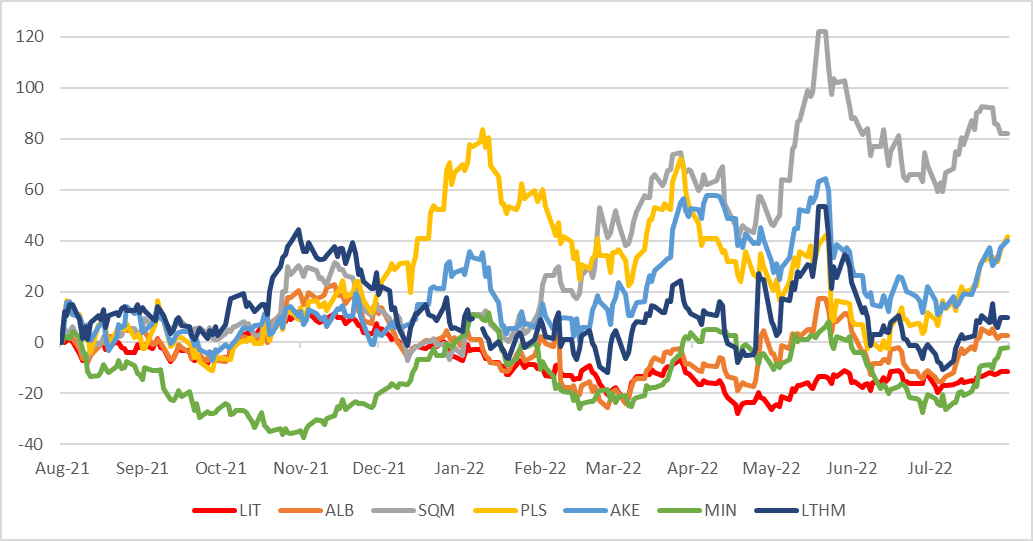
Given the spike in LCE prices by over 500% in the last 12 months, investors may have sought out an ETF to gain exposure and diversification in mostly non US stocks. Unfortunately LIT cannot capture this price spike.
LIT vs LCE prices (Created by author with data from Trading Economics)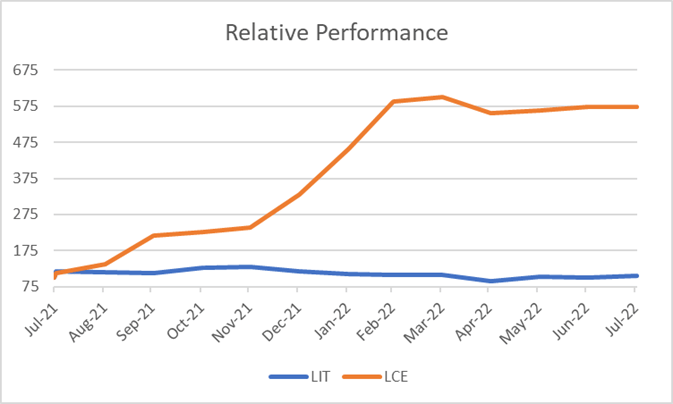
What is LIT
LIT is part of the Global X ETF funds managed by Mirae an innovative Korean asset manager. This ETF, in my view, is far more appealing for investors that want global exposure to Asian EV battery manufactures vs. global lithium producers. LIT tracks the Solactive Global Lithium Index, which is made up of 39 stocks, 69% weighted in EV Battery makers such as EVE Energy, LG Chemical (OTCPK:LGCLF), TDK (OTCPK:TTDKY) and CATL. Plus Tesla and BYD, which have limited direct battery sales. While Lithium exposure is concentrated in Albemarle (ALB), SQM and Ganfeng Lithium (OTCPK:GNENY).
LIT does give an investor access to companies in Asia normally not available to US investors. Of particular interest is LG Chem and Samsung SDI (OTCPK:SSDIY) as well as CATL the three global battery leaders plus a host of Chinese EV battery component makers.
Holdings
LIT Holding and Key Data (Created by author with data from LIT and Capital IQ)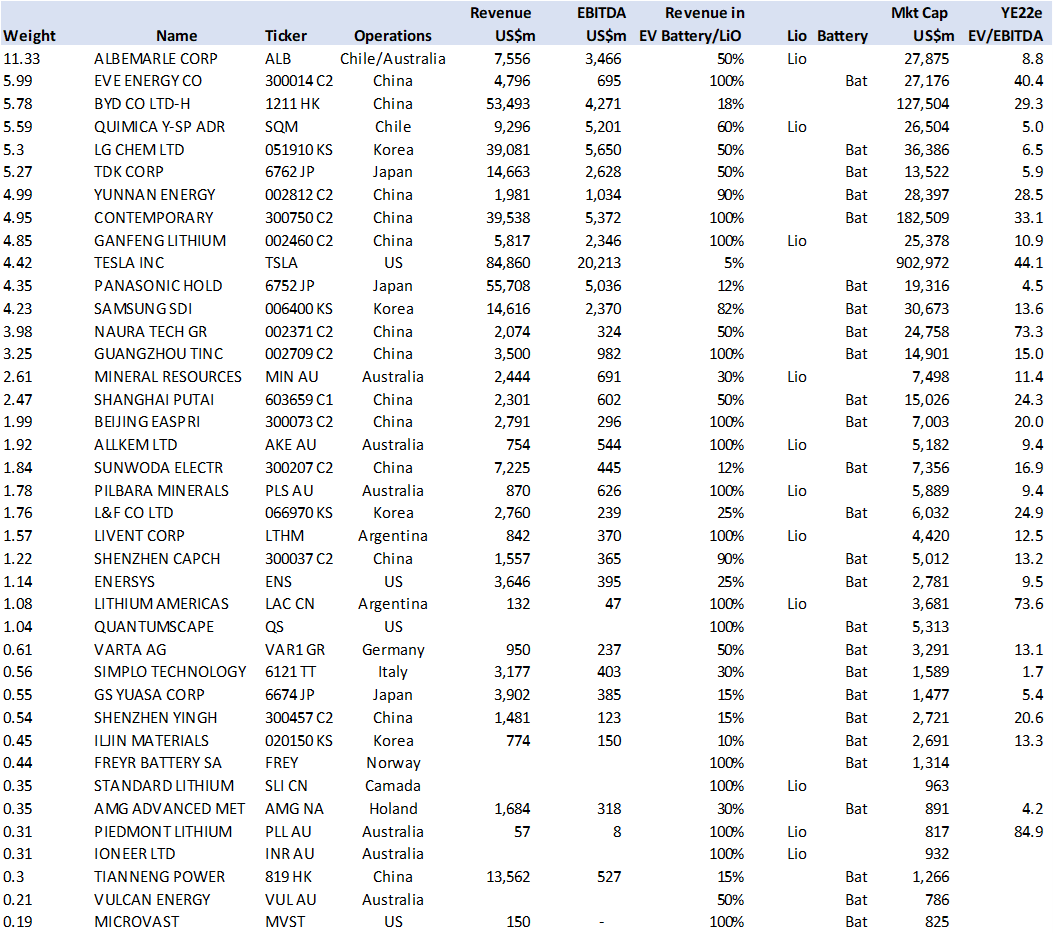
Battery vs Raw Materials
The question is: What are you looking for as an investor? EV battery makers or EV metal raw materials?
Battery makers are original equipment manufacturers (OEM) for the EV auto assemblers. They should have less execution risk as they sell business to business on a long-term cost-plus contract basis, as is the case for most OEMs. This means they can pass on raw material costs and work with auto companies to design battery packs for each auto platform. They need to focus on managing production costs i.e., productivity and scale. Growth should be quite high on EV penetration and unit sales but it’s also an ever-increasing competitive sector, with many countries looking to assure “national energy security” and bring manufacturing on shore. It’s possible that the battery makers venture into vertical integration and acquire lithium producers.
The EV metal raw material providers have greater price/margin risk and upside. They are currently price makers in a rapidly growing industry and in my view should gain outsized returns until the EV market reaches a more mature level. Recent studies indicate volume demand exceeding 30% a year in key metals such as Cobalt, Nickel, Lithium and Graphite.
EV Metal Volume Growth to YE2030 (Created by author with data from IEA)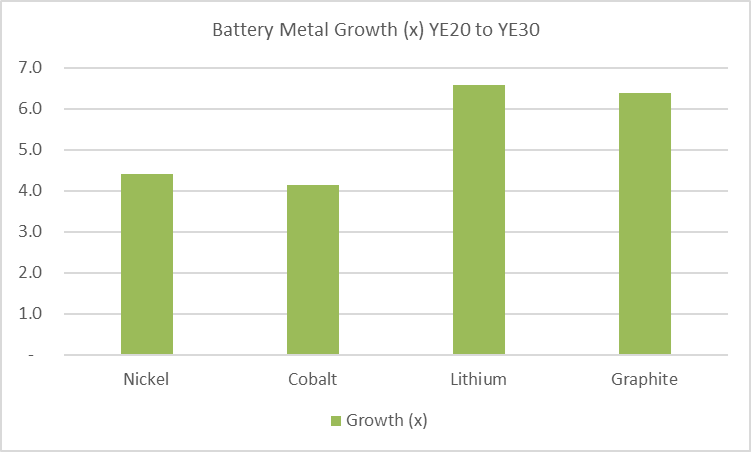
Conclusion
LIT is better suited for investors seeking exposure to EV battery production and growth, particularly in Asia, rather than a Lithium demand proxy.
[ad_2]
Image and article originally from seekingalpha.com. Read the original article here.