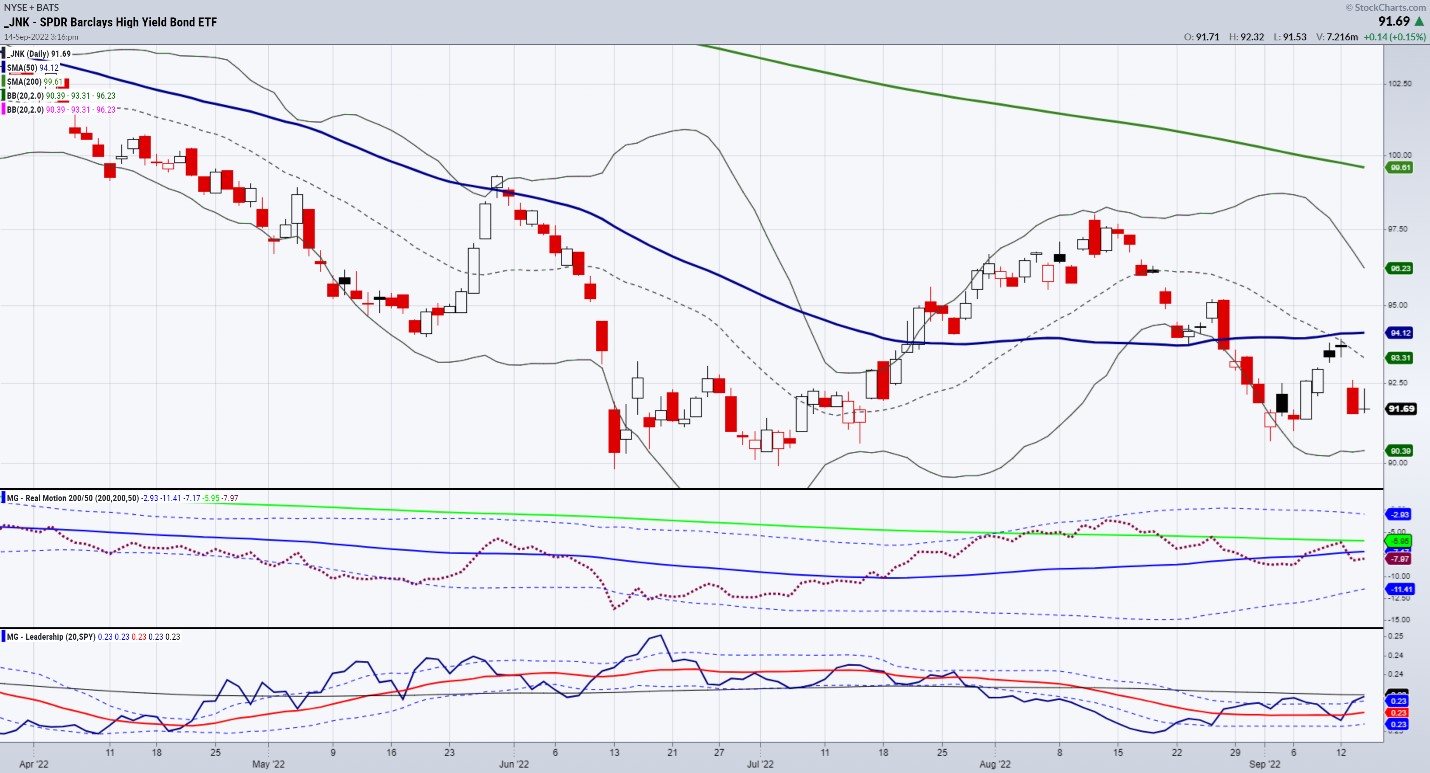
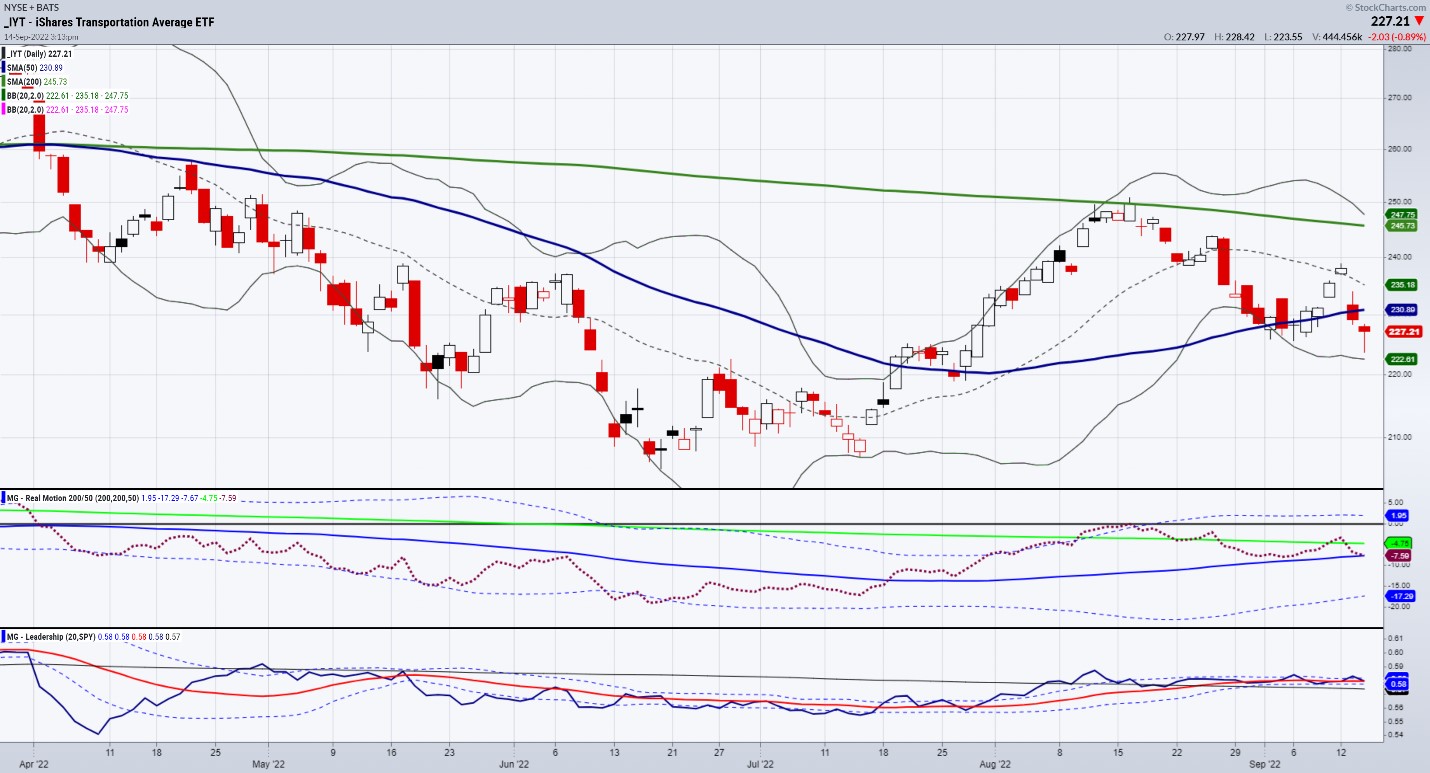
After Tuesday’s stock market rout, the outperforming sector transportation (IYT) struggled on Wednesday. Although our other indicator we have been writing about, junk bonds (JNK), led the rally in the indices, IYT did not follow.
Why?
A Western-style showdown between 60,000 rail workers, their unions and some of the largest U.S. railroad operators is already having an impact on the market. We brace ourselves as the outcome stands in the balance.
According to CNBC, a strike can cost the U.S. economy $2B in economic output per day. Furthermore, there are reports of railways stopping to take grain and animal-feed shipments. Other raw material deliveries are also facing uncertainty, like coal transports. In an already delicate energy crunch ahead of the winter, this will not help supply/demand. Estimates are that 45% of all freight in the U.S. might be impacted.
One bit of a potential good news, ten of the twelve transportation-related unions have already struck deals to avert a strike. With the dispute mainly about pay hikes, time off and sick-leave, it is possible this will all go away. If, however, things get real bad, Congress may be forced to impose contractual terms or send the dispute to forced arbitration.
Regardless of whether a strike is averted or unfolds, this week’s sell-off offers traders opportunities. The chart of IYT, although under the 50-DMA now (blue line), holds the real motion momentum indicator’s 50-DMA. And while IYT outperformed SPY, it is now slightly underperforming. This chart is key to watch, as the best clues on the unions and the implications can be seen here.
Next key chart is our recent favorite, junk bonds.

With a green day (at time of writing), a move to the fast-moving average and a stronger outperformance to the SPY, the bias near-term is more neutral to slightly bullish unless it breaks under Tuesday’s low.
Finally, the oil and natural gas charts are already moving higher after holding their key moving averages. Fundamentally, oil reserves are low and demand, should it increase, can strain the low supply further.
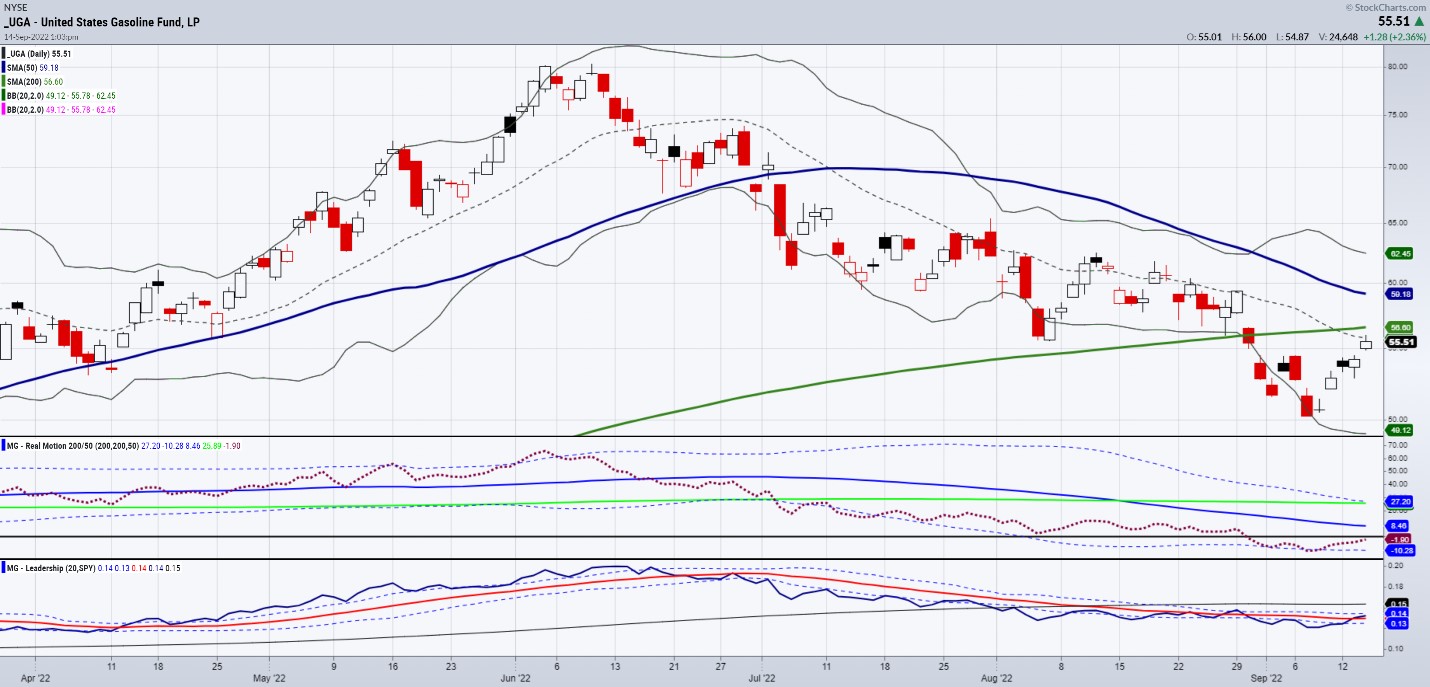
A lesser looked-at chart is that of the U.S. Gasoline Fund (UGA). Almost all ethanol is produced in the Midwest and moved by rail. Ethanol currently accounts for around 10% of U.S. gasoline volume. The reprieve in gas prices from the highs could be short-lived, which of course is inflationary.

UGA is under the major moving averages. Looking at the real motion indicator along with price, it had a mean reversion setup September 7th. Now, should it clear 56.60, we like it for a long position with a risk around 54.50.
If the strike happens, and the gas ETF moves higher, I would anticipate that IYT and JNK, as we move more to inflation fears and risk off, will decline.
To learn more about how we invest profitably during these times, please reach out to Rob Quinn, our Chief Strategy Consultant, by clicking here.
Mish’s Upcoming Seminars
ChartCon 2022: October 7-8th, Seattle (FULLY VIRTUAL EVENT). Join me and 16 other elite market experts for live trading rooms, fireside chats, and panel discussions. Learn more here.
The Money Show: Join me and many wonderful speakers at the Money Show in Orlando, beginning October 30th running thru November 1st; spend Halloween with us!
 Get your copy of Plant Your Money Tree: A Guide to Growing Your Wealth and a special bonus here.
Follow Mish on Twitter @marketminute for stock picks and more. Follow Mish on Instagram (mishschneider) for daily morning videos. To see updated media clips, click here.
See Mish’s latest article for CMC Markets, titled “Can the Fed Still Engineer a Soft Landing for the US Economy?”
Mish joins Business First AM to examine the question “will the market go off-track?”
Mish sat down with Yahoo Finance to talk about headwinds that could stall the rally.
Mish hosted the Monday, September 12 edition of StockCharts TV’s Your Daily Five, where she discusses the most influential aspects to the market, from the dollar, to bonds, to commodities.
In this appearance on Cavuto Coast to Coast, Mish, Jonathan and Neil discuss inflation — somehow, it all comes back to that.
Mish joins Maggie Lake of Real Vision Finance to talk about key levels for stocks, bonds, crypto and the dollar. Mish also shares critical information about hot sectors such as solar and EVs, emerging markets and trends, and the all-important commodity sector.
- S&P 500 (SPY): Confirmed return to bear phase; 389 support, 400 resistance.
- Russell 2000 (IWM): Confirmed return to bear phase; 178 support, 184 resistance.
- Dow (DIA): Confirmed return to bear phase; 308 support, 314 resistance.
- Nasdaq (QQQ): Confirmed return to bear phase; 290 support, 296 resistance.
- KRE (Regional Banks): Confirmed return to bear phase; 62 support, 63.5 resistance.
- SMH (Semiconductors): 202 support, 206 resistance.
- IYT (Transportation): Confirmed return to bear phase; 224 support, 230 resistance.
- IBB (Biotechnology): Confirmed return to bear phase; 120.50 support, 124.10 resistance.
- XRT (Retail): Confirmed return to bear phase; 61.60 support, 63.50 resistance.
Mish Schneider
MarketGauge.com
Director of Trading Research and Education


