

[ad_1]
Evgenii Mitroshin
Recession fears are top of mind. While the U.S. CPI rate hums along above 9%, there are clear signs that inflation may have peaked in June. Just take a look at WTI crude oil prices—the benchmark energy commodity dropped from above $123 during the middle of last month to below $95 by last Friday’s settle.
WTI Crude Oil Drops Under $95 As Recession Fears Mount
Stockcharts.com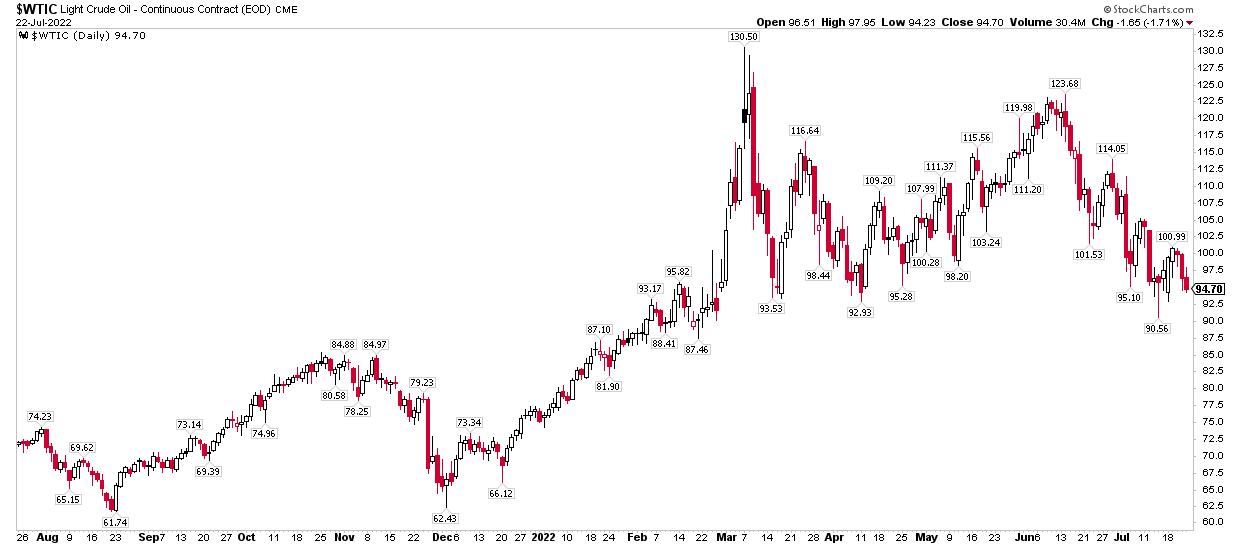
Energy stocks have felt the brunt of that selling pressure. Since July 8, the Energy Select Sector SPDR ETF (XLE) is in bear market territory, down more than 22% (including dividends), in just the last 31 trading days. It is the worst sector ETF by a wide margin over that time.
Energy’s Fall From Grace
Stockcharts.com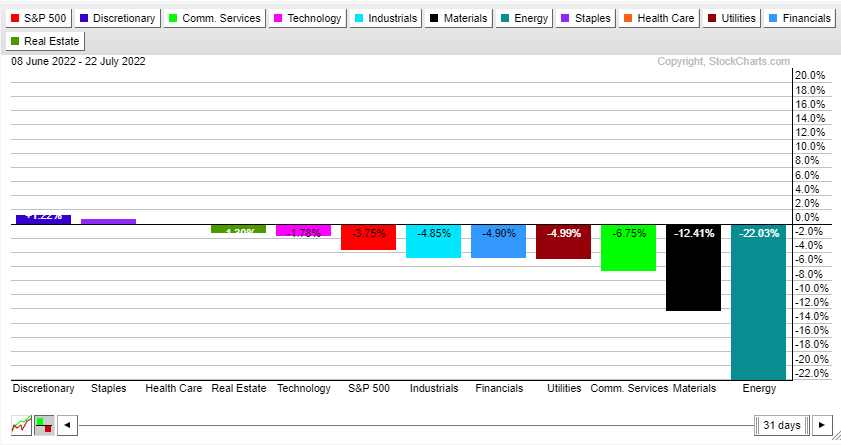
Digging deeper into energy’s purgatory, small-cap shares are faring even worse. The Invesco S&P SmallCap Energy ETF (PSCE) was up almost 80% on the year at its June high but is now higher by just a smidgen more than 20% for 2022. PSCE is effectively a higher-beta play on XLE.
Energy Small Caps Rise More, Fall Harder vs XLE
Stockcharts.com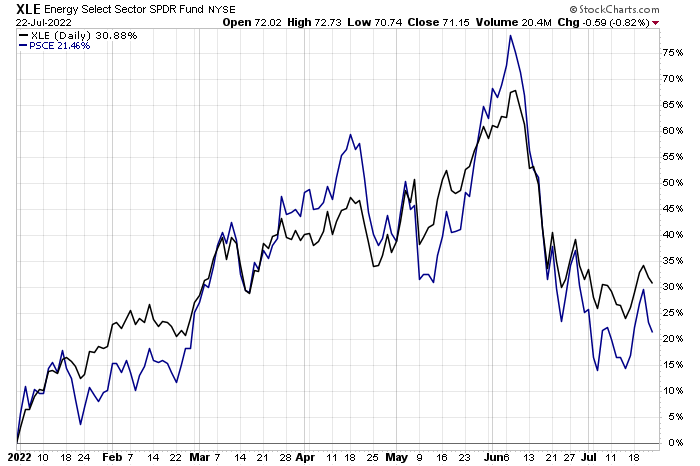
I find a compelling story (and data) with one small-cap energy stock: SandRidge Energy (NYSE:SD).
According to Fidelity Investments, SandRidge Energy, Inc. engages in the acquisition, development, and production of oil and natural gas primarily in the U.S. Mid-Continent. As of December 31, 2021, it had an interest in 817.0 net producing wells; and operated approximately 368,000 net leasehold acres in Oklahoma and Kansas, as well as total estimated proved reserves of 71.3 million barrels of oil equivalent. The company was incorporated in 2006 and is headquartered in Oklahoma City.
The stock trades with a price to free cash flow multiple of just 5.6, according to Koyfin Charts data. That is at the low end of its 18-month range. That translates into a free cash flow yield of a whopping 18%. Moreover, the WSJ reports that SD’s trailing twelve-month P/E ratio is a scant 5.4, based on its more than $3 of earnings over the last year.
A Compelling Free Cash Flow Multiple
Koyfin Charts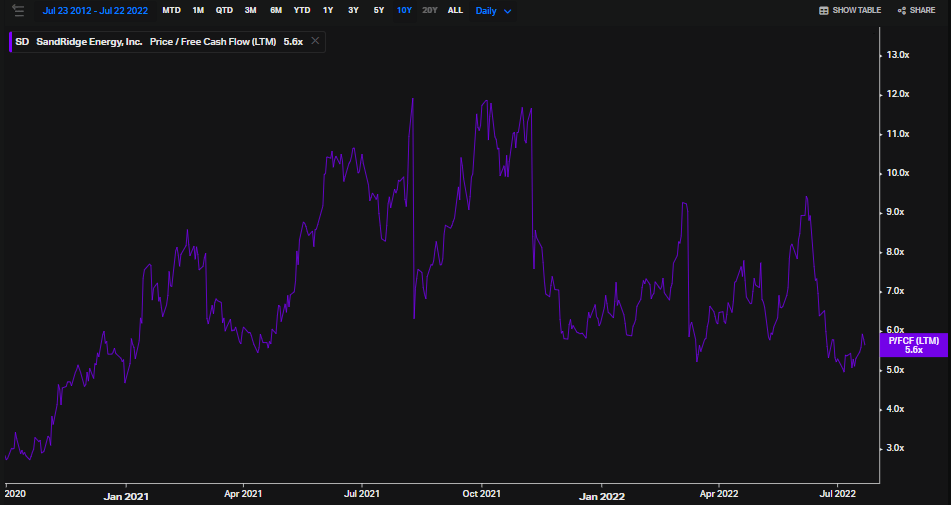
We will get more clues on SandRidge’s profitability situation on August 3rd when the company has an unconfirmed Q2 earnings date, according to Wall Street Horizon. The corporate event calendar does not stop there, though. There could be more volatility on Tuesday, August 9, when the company has a pending speaking engagement at the EnerCom 27th Annual Energy Investment Conference.
SandRidge Q2 Earnings On Tap, Industry Conference Follows
Wall Street Horizon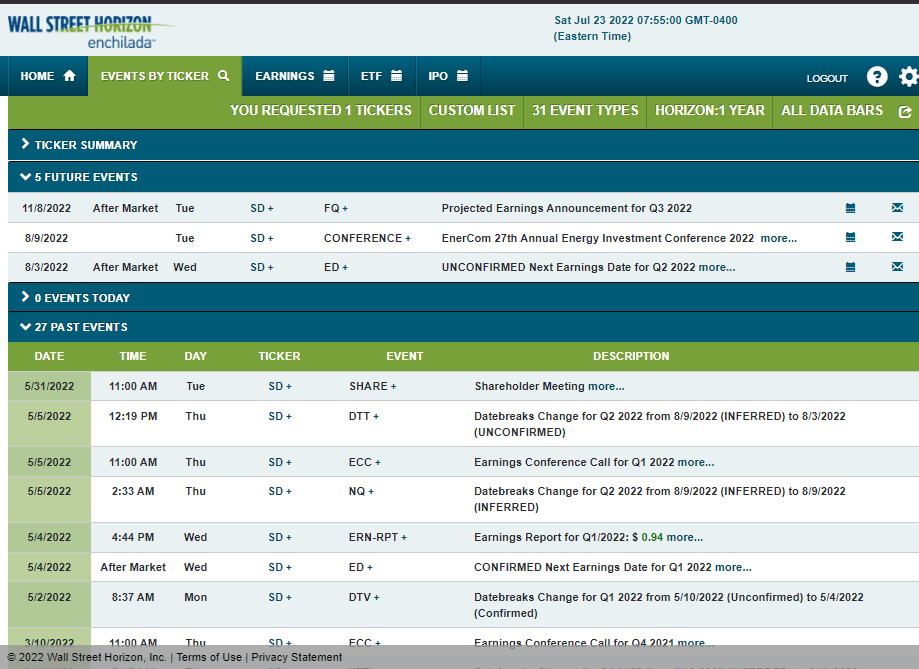
The Technical Take
SD’s chart might upset your stomach. The roller coaster ride began when shares started trading in 2016. After peaking near $27, the stock plummeted to just $0.70 when WTI went negative in April 2020. The rally off near zero was incredible—SD rose to an all-time high above $29. Investors endured a whopping 52% crash in less than a month from June to early July. Shares then found support at a key spot near $14. That is a tradeable low in my technical eye. Going long here based on that level of significance is a way to play it. Next support is near $9. Resistance could be near $22, but all eyes will be on the $29 all-time high.
SD: Shares Crash To Support
Stockcharts.com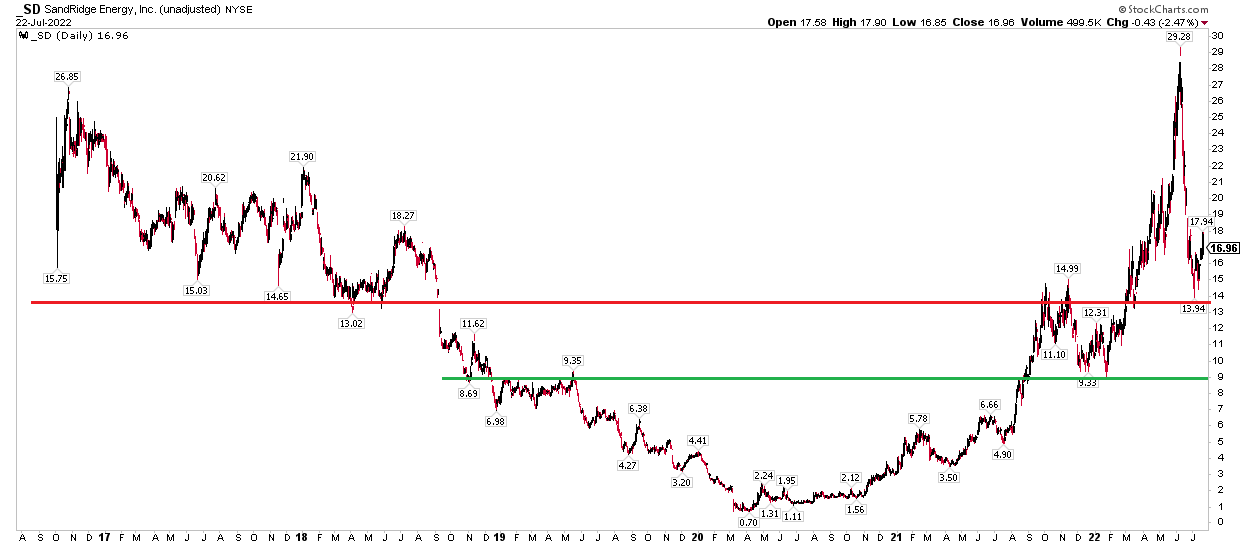
The Bottom Line
SandRidge Energy’s 50% pullback brings the stock to a great valuation and an intriguing technical spot. Traders should consider a swing long here with a stop below $14 while long-term investors might put some of their energy exposure to this extremely high-beta small-cap energy name.
[ad_2]
Image and article originally from seekingalpha.com. Read the original article here.