

[ad_1]
bjdlzx
The Fed announcement gives a rocket booster to this bear market (NYSEARCA:SPY) technical bounce, as it dreams about reaching for the stars. Monster stocks missing earnings expectations, like Alphabet (GOOGL), and the stock goes up, when everyone knows ad revenues fall during a recession. GDP down for two quarters flashes “recession”, but high employment flashes “no recession.”
Recession Narrative
The SPY is believing the recession narrative and that this narrative will force the Fed to back down from a 75 basis point increase in September. However, not so fast, because the Fed says it will not ease until it sees its targeted inflation rate of 2% coming down the pike. That is nowhere in sight.
No matter what the narrative, we don’t fight the tape, nor this surprising move up in the SPY. We follow the existing buy signals until they turn down. You can see these buy signals on both the daily and weekly charts shown below. That’s a win/win.
When this move up hits a wall of resistance, as it must, we will see the first signals on the daily chart. Then, when the weekly chart Sell signals appear, we will know the market is heading down to retest $364. We think this happens in September, and expect to see the market bottom in October. A recession will take us to a bottom well below $364.
Enjoy This Move Up
Meanwhile let’s enjoy the ride, reaching for the stars, until it comes to an end. After all, that is the way to make money in the market. We have to go with the buy signals on both the daily and the weekly charts shown below. That one-two punch accounts for the big gain in the SPY for the month of July.
The bounce to the stars ends as earnings season ends. Then the market starts thinking about the rising dollar, the falling GDP, earnings only beating lowered expectations, analysts dropping earnings estimates, the war, the recession in Europe, rising prices on everything, etc. All this without the benefit of positive earnings rolling in everyday.
The Next Reality Check
The September rate hike by the Fed will be the reality check. Any announcement of increasing inflation will take the market down. We expect this because you can’t turn inflation down immediately. This is like turning an aircraft carrier, not a destroyer.
Plus it is well known that increasing interest rates is a very slow, working cure for inflation. You can massage gasoline prices lower quickly, but not the whole CPI. Besides, sticker shock on cars, restaurant prices and food bills will continue to kill consumer demand except for the basics. Watch out Alphabet and Amazon (AMZN). Meta Platforms (META) is already crashing.
Apple (AAPL) is proving iPhones are a necessity. Chipotle (CMG) is proving its food addicts ignore higher prices. That may change when unemployment increases. Increasing unemployment will trigger the Fed to stop raising rates. That is next year, not this September.
Here is our daily chart showing all its buy signals that will make you money as they did in July:
SPY Buy Signals Take Price Higher (StockCharts.com)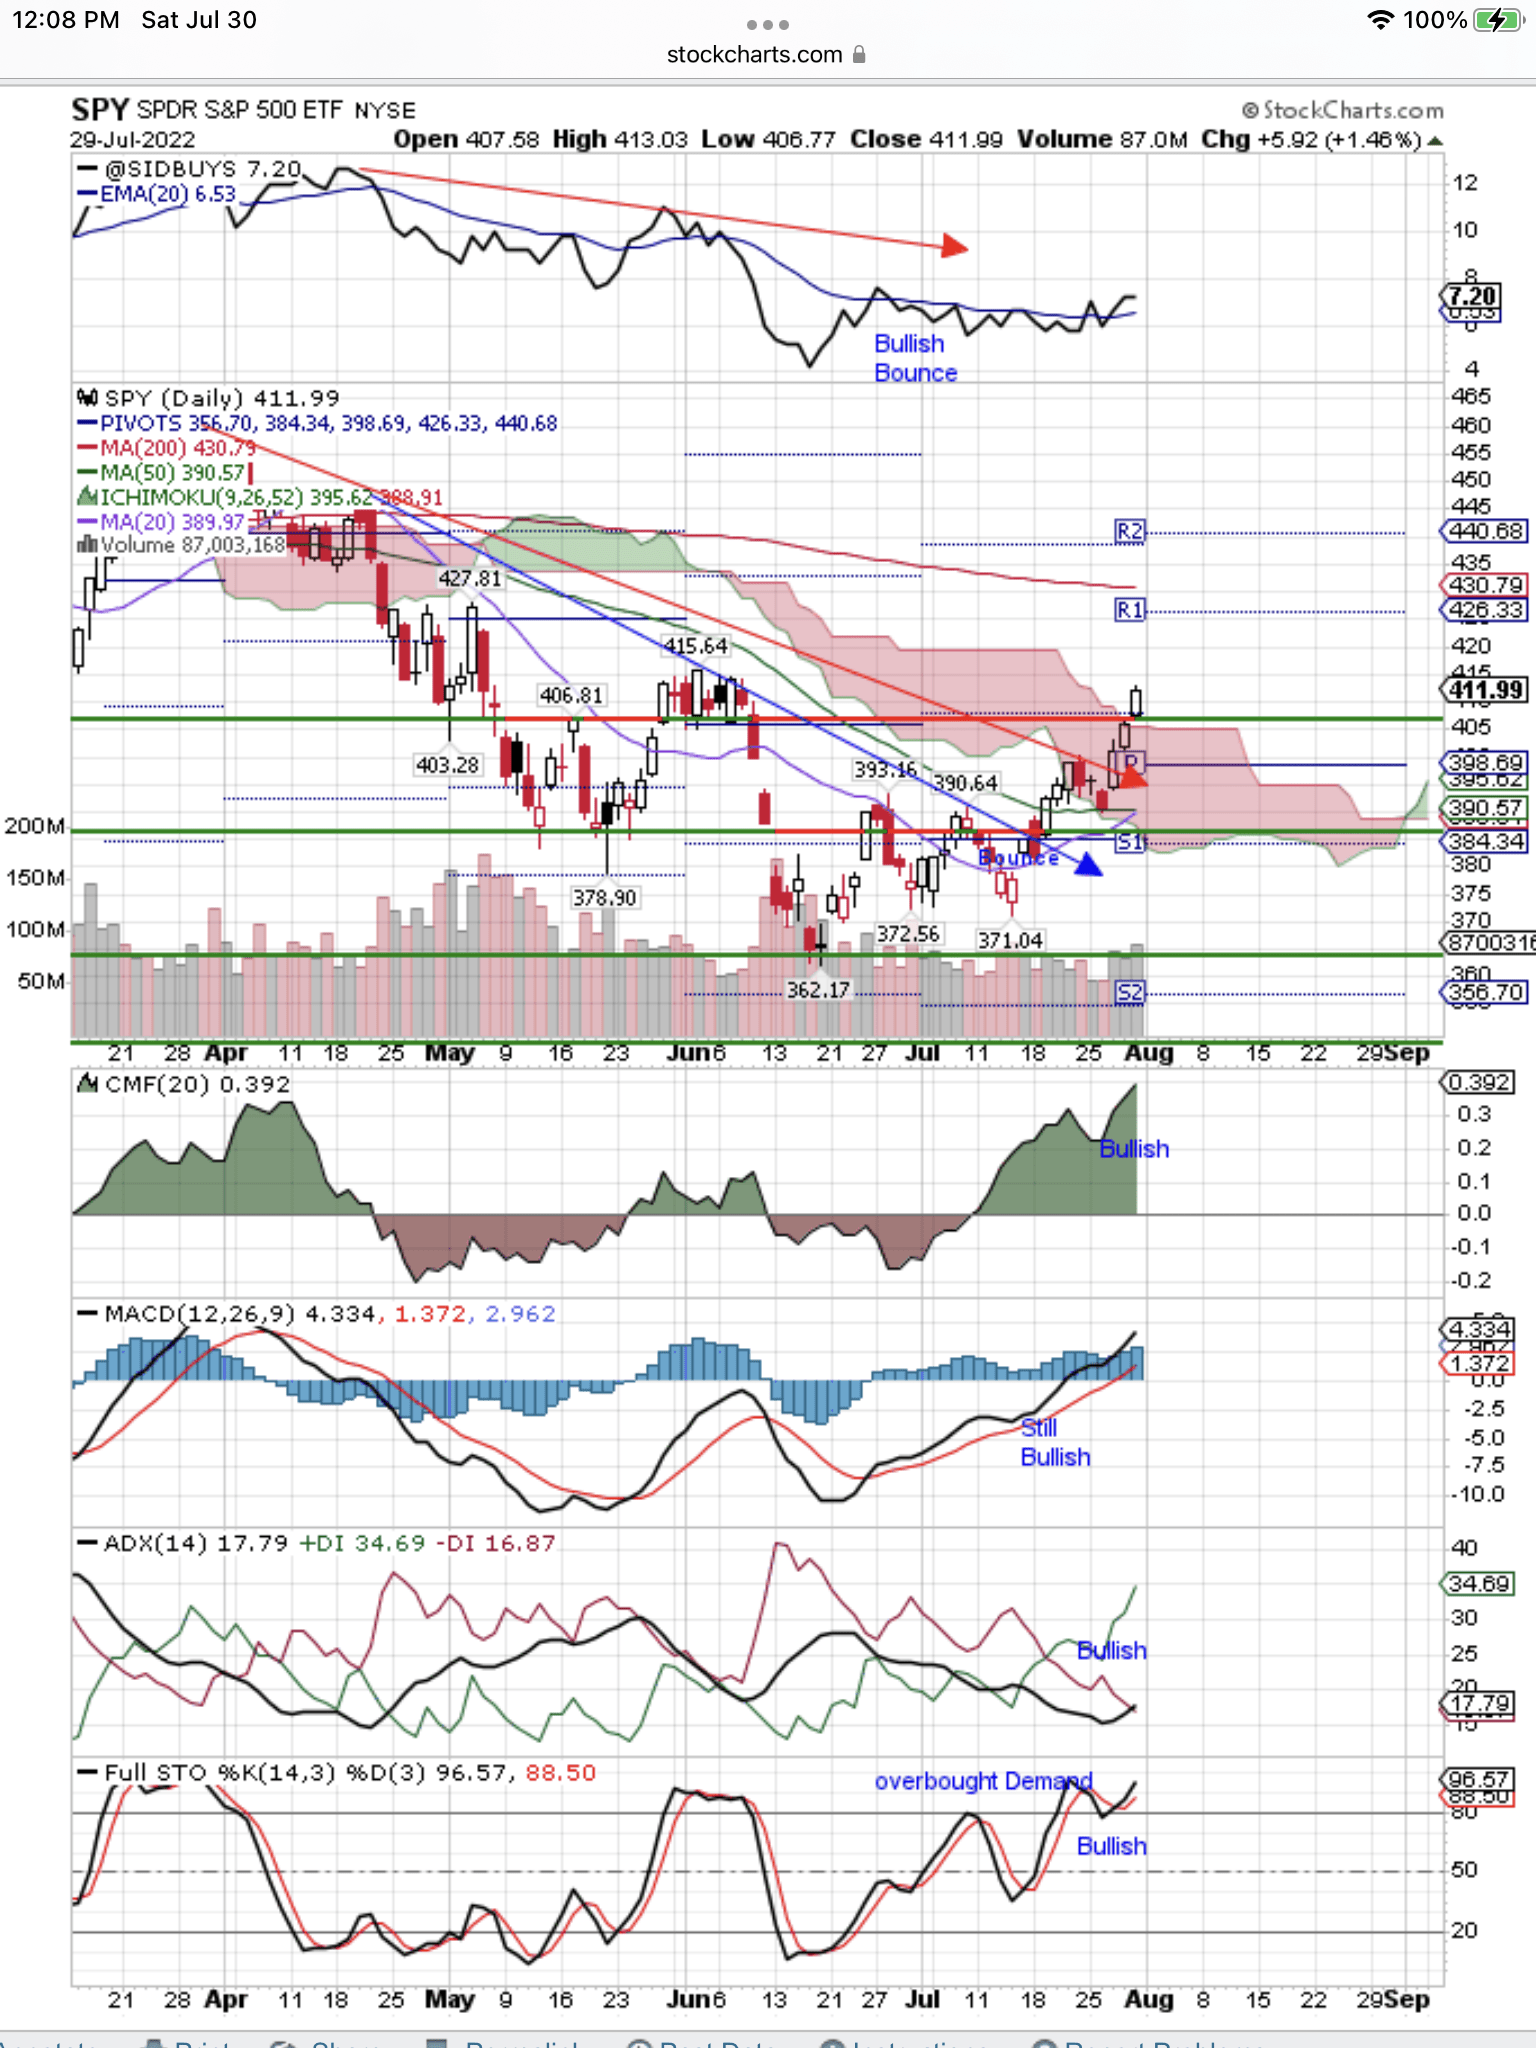
NOTE: The last high before the big drop to $362 was at $415.64. Price has moved up to retest that important resistance level. The bounce up was very strong because of the price gaps on the way down, providing little resistance on the bounce up. We are looking for a reversal ~$416. The long term, bear market downtrend is shown by the 200-day moving average now at $430 on the chart. That is the big hurdle this market has to overcome. The end of the war would do it. The end of inflation would also do it. Until then, the bear market continues.
Below is the lagging, weekly chart. The Sell signals will appear, lagging the Sell signals on the daily chart, but the signals will be more reliable. Notice that the current buy signals are in sync with the daily chart and that provides a win/win combination in both leading and lagging signals. It explains why this bounce is so strong.
SPY Improves to Weak Hold Rating (StocksInDemand.com)
NOTE: All the signals are short term bullish, but still long term bearish. You can see price reaching to test the long term, bearish, downtrend red arrow. We believe this is the “reversal ahead”. Notice at the top of the chart is our proprietary Buy/Hold/Sell signal. It has improved to a “Weak Hold” rating with a score of 58 out of a possible 100. There is no bottom formation in place and that is why we expect a reversal to retest the bottom. (The blue, vertical line, bullish, is triggered by the signal at the bottom of the chart.)
[ad_2]
Image and article originally from seekingalpha.com. Read the original article here.