
SPX Monitoring Purposes: Long SPX on 5/31/22 at 4151.09.
Monitoring Purposes GOLD: Long GDX on 10/9/20 at 40.78.
Long Term SPX Monitor Purposes: Neutral.
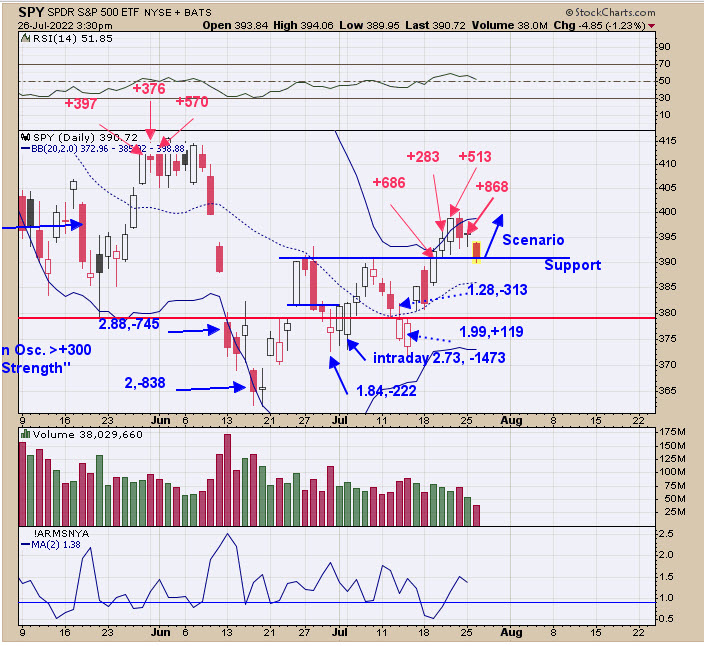
The FOMC meeting ends Wednesday, with the announcement coming at 2:00pm Eastern. Yesterday, we said “It’s common for the market to reverse around the FOMC meeting. If the market rallies into the meeting, then we can have a reversal down, while if the market declines into meeting, than a reversal up is common. As you know, we do a lot with the TICK and TRIN. The chart can get messy displaying the TICK closes, so we just recorded the last significant three-day reading, which came at the May high (we disregarded the TICK readings over the “Sign of Strength” in the 4 day MA of A/D, which reached 4 along with the McClellan Osc. over +300). However the TICKs won out. We now have another three-day TICK reading that has reached extremes again >+1350 ending last Thursday. This three day TICK close suggests short term exhaustion, and I might add today’s tick closed at +794. The third quarter is also the weakest quarter of the year. I’m not looking for a major decline, but a pullback is possible. The TRIN closes back at the mid-June low suggest strong support near 365 SPY. Still long SPX, but may be seller shortly.”
Today, the SPY retraced back to the previous high near 390 ranges on lighter volume, which suggests support. It looks at though there could be a bounce coming on the FOMC announcement.
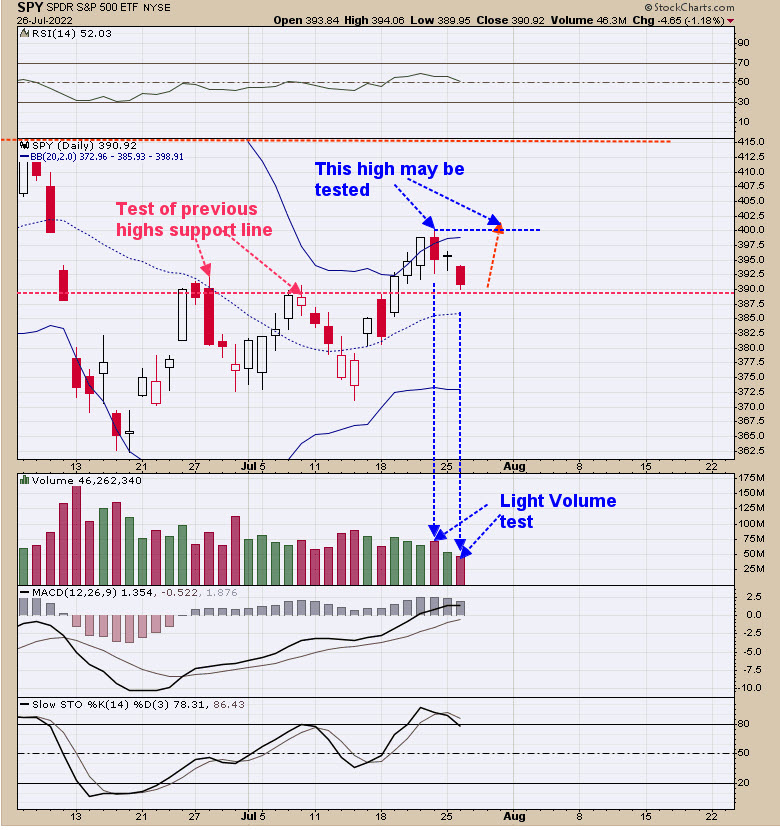
Here is a possible scenario that may unfold in the short term. Last Friday’s high came on higher volume than the previous day’s volume, which suggests Friday’s high may be tested as most high volume days are tested. Today’s decline broke below Friday’s low on lighter volume, suggesting a false break and that the market may reverse short term. These leaves the door open for a test of last Friday’s high. If last Friday’s high is tested and the test come on light, that will suggest the Friday high has resistance. As pointed out on page one, there has been a lot high uptick closes, which suggests short term exhaustion. If, indeed, Friday’s high is tested on lighter volume, there could be at least a short term high.
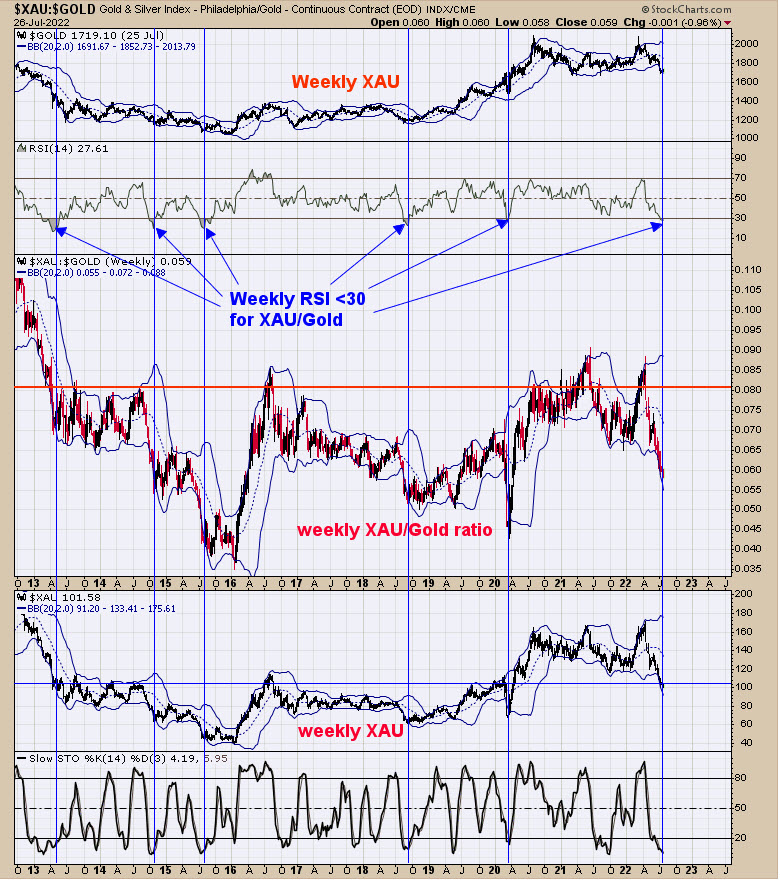
Yesterday, we showed the GDX Up Down Volume percent with a 50-day average and the GDX Advance/Decline percent with a 50-day average. In early July, both indicators traded below -20. At previous times when both indictors traded below -20, GDX was at intermediate term low. The second window down from the top is the weekly RSI for the XAU/gold ratio. Intermediate-term lows formed in XAU when the weekly RSI for the XAU/Gold ratio fell below 30 (current RSI lies at 27.61). This indicator generates a signal about once every year and a half, and the indicator lines up well with the 50 MA of the Up Down Volume and Advance/ Decline indicators showed in yesterday’s report. The more indicators that line up for a low, the more likely a low is being made. This low could be an intermediate term low and the potential rally could last into October, maybe longer.
Tim Ord,
Editor
www.ord-oracle.com. New Book release “The Secret Science of Price and Volume” by Timothy Ord, buy at www.Amazon.com.
Signals are provided as general information only and are not investment recommendations. You are responsible for your own investment decisions. Past performance does not guarantee future performance. Opinions are based on historical research and data believed reliable, there is no guarantee results will be profitable. Not responsible for errors or omissions. I may invest in the vehicles mentioned above.