
[ad_1]
John Kevin
Morningstar’s Amy Arnott wrote a column exploring whether dividend stocks provide shelter from a recession. It’s a good article, and after reading it, we had a question. How would the S&P 500 (Index: SPX) compare with the three categories of dividend funds she discussed?
Those dividend stock fund categories include growth, growth and income, and income. In the following table, she gives some useful metrics for comparing how each type has performed during the past five years.
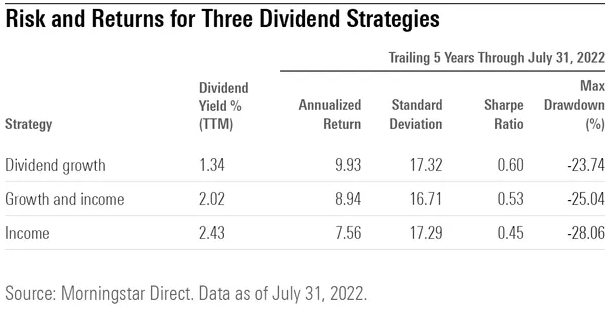
The table presents the trailing twelve-month dividend yield for each type of dividend stock fund, and also the five-year performance of each category for their Annualized Return, Standard Deviation (a measure of volatility), Sharpe Ratio (a risk-adjusted measure of investment return), and their Maximum Drawdown (the largest downward trend experienced from peak to trough).
We tracked down the same measures for the S&P 500. In the following chart, we’ve visually compared the index’s dividend yield and 5-year annualized return with that of each of the dividend fund categories. We’ve also indicated the Sharpe Ratio for each in the column headings.
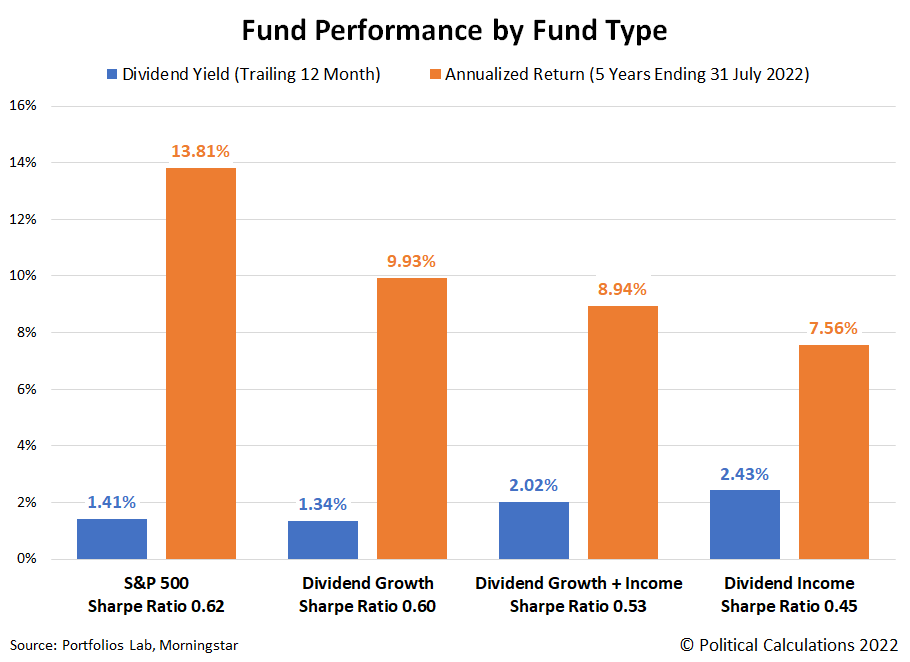
Although they have the lowest dividend yields, the S&P 500 and Dividend Growth fund categories provided the best total returns. That’s also true after considering their Sharpe Ratio values, for which Arnott had indicated for the Dividend Growth category “posted the best combination of risk and return”, beating the other two types of dividend funds. Speaking of which, Arnott recognizes that the dividend stock funds might have recorded better returns if not for having higher fees. She found that low-cost funds outperformed high-cost funds for overall returns.
The next chart compares the S&P 500’s and the three dividend stock fund categories’ standard deviation (volatility) and their worst recorded downward trend over the past five years.
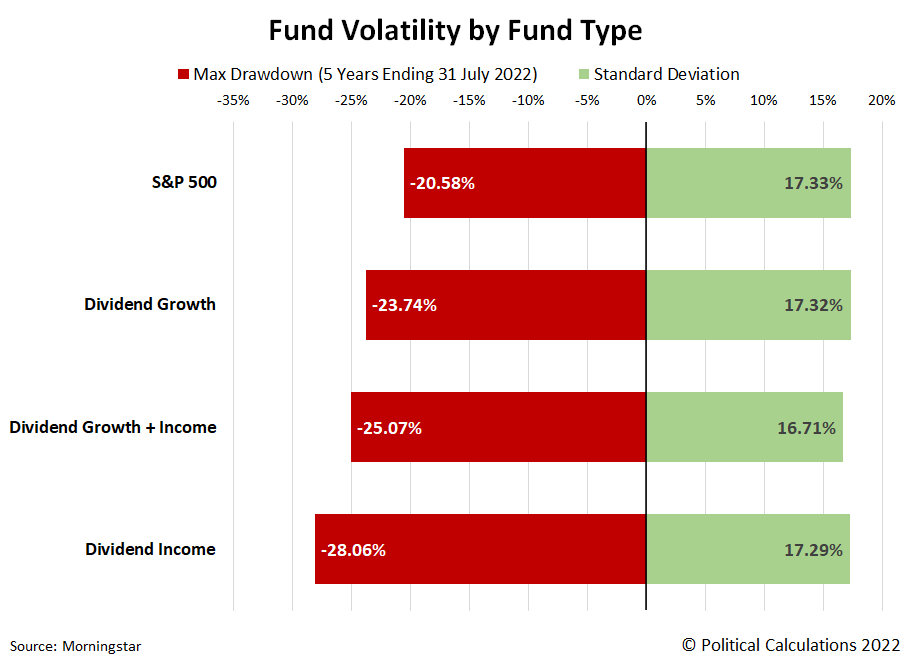
The standard deviation data for the S&P 500, Dividend Growth, and Dividend Income funds were all similar, with the Dividend Growth and Income fund recording the lowest volatility. Meanwhile, the S&P 500 clearly outperformed the other fund types by recording the smallest drawdown during the past five years, with Dividend Growth funds ranking second lowest. Dividend Income funds recorded the most adverse drawdown in the five-year period ending on 31 July 2022.
Altogether, the data indicate the S&P 500 had the best overall performance, followed by Dividend Growth funds, then Dividend Growth and Income funds, and finally, Dividend Income funds.
References
Arnott, Amy. Do Dividend Stocks Provide Shelter From Recession? Morningstar. 8 August 2022.
Morningstar. S&P 500 PR Risk Data. [Online Application]. Accessed 14 August 2022.
PortfoliosLab. S&P 500 Portfolio Trailing Twelve Month Dividend Yield [Online Application]. Accessed 14 August 2022.
Editor’s Note: The summary bullets for this article were chosen by Seeking Alpha editors.
[ad_2]
Image and article originally from seekingalpha.com. Read the original article here.