

I’ll use the S&P to illustrate the US Indices picture
The chart above, the 13-week swing (quarterly trend), shows a potential sideways structure in the making. As the S&P, cash, moved into the Primary Sell Zone, the weekly volume has declined.
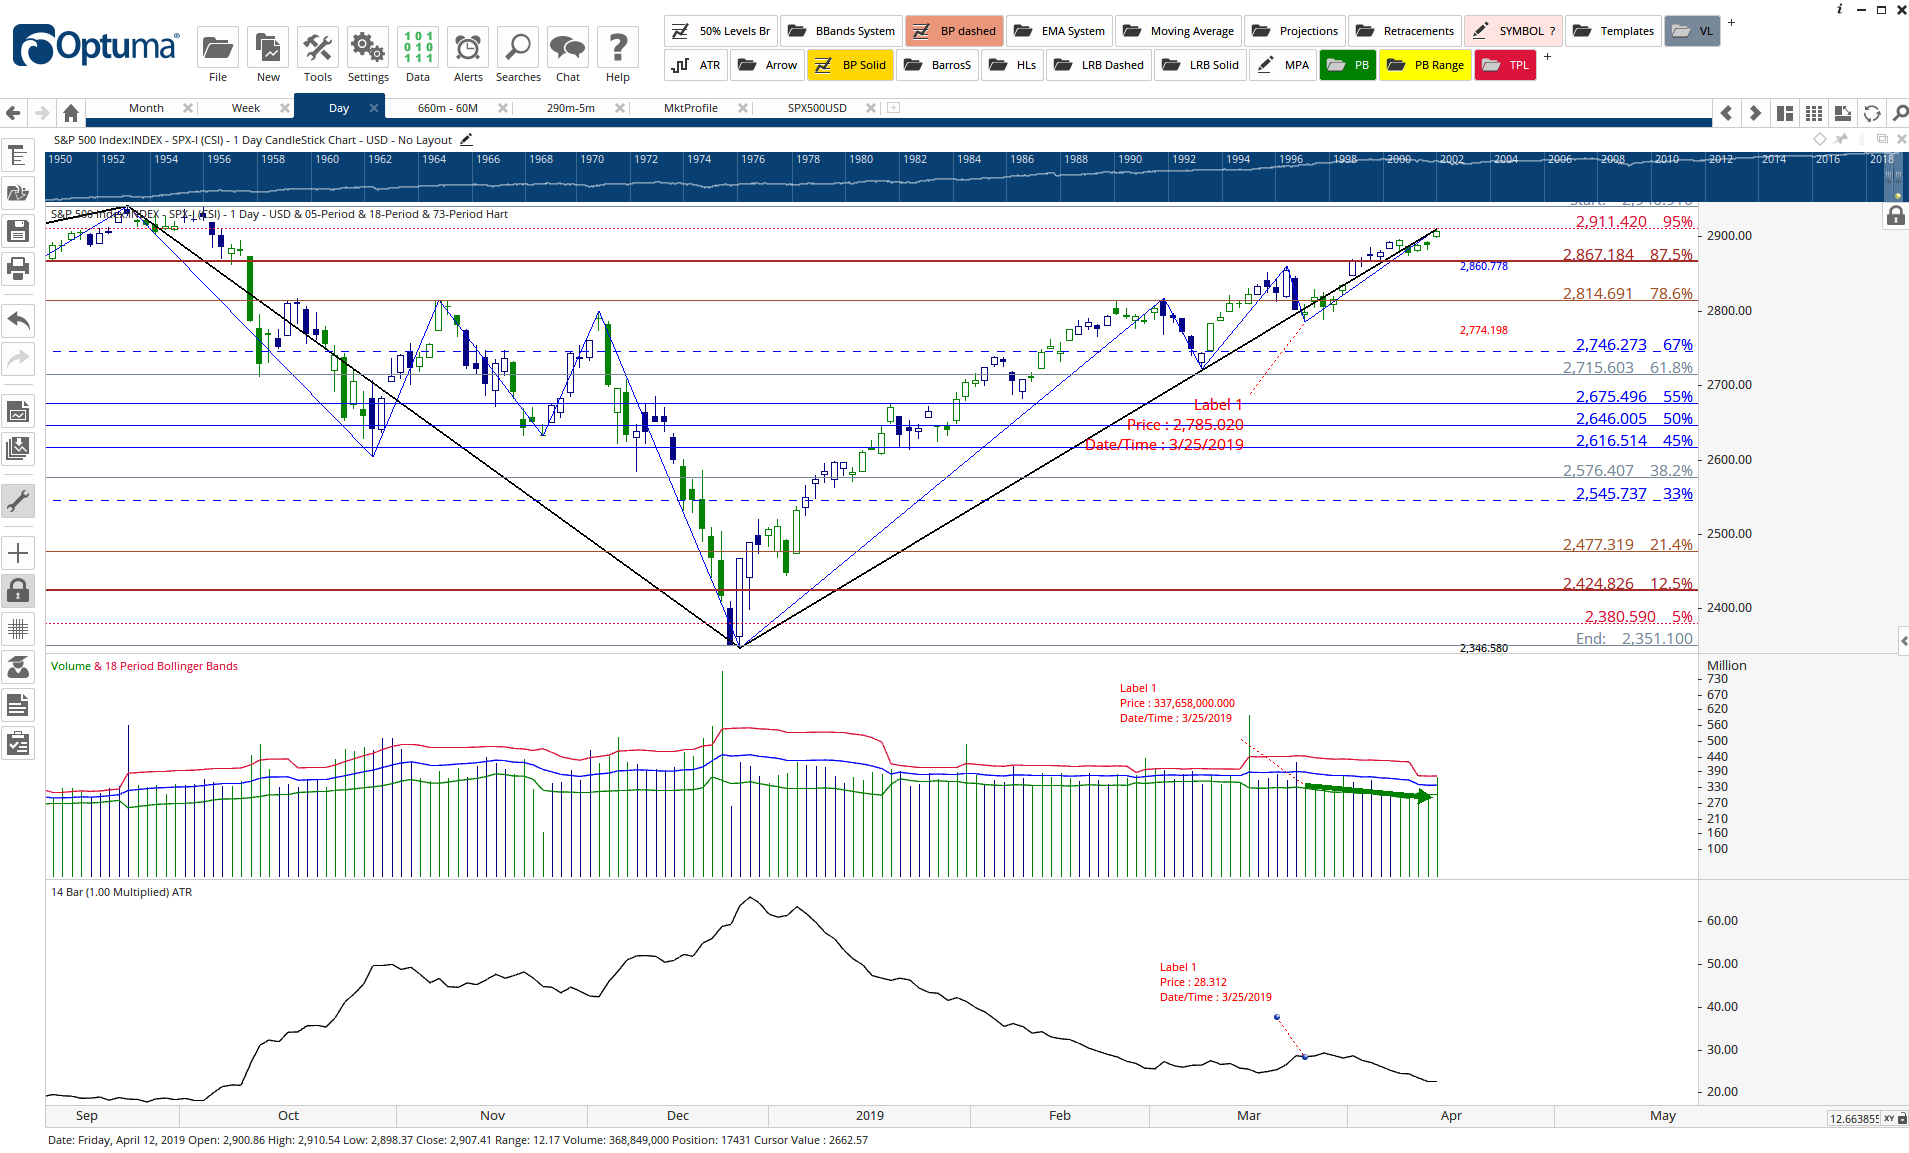
I have placed a 14-day ATR on the daily chart. Even more pronounced than the volume decline is the decline in range.
Normally, I’d be looking for a shorting opportunity – we see zone and setup. However, we have the FED and trader sentiment to contend with. We have seen before this pattern of:
- a grinding uptrend
- accompanied by declining volume and range
Have a look at an S&P chart for August 2016 to January 2018.
The reason why prices rose without worrying about the bears was due to QE. Can it be that traders will see in a Powell FED the same sort of policies?
I’ll be wanting to see some evidence of a FED forced to raise rates or evidence that bears have re-entered before taking any shorts.