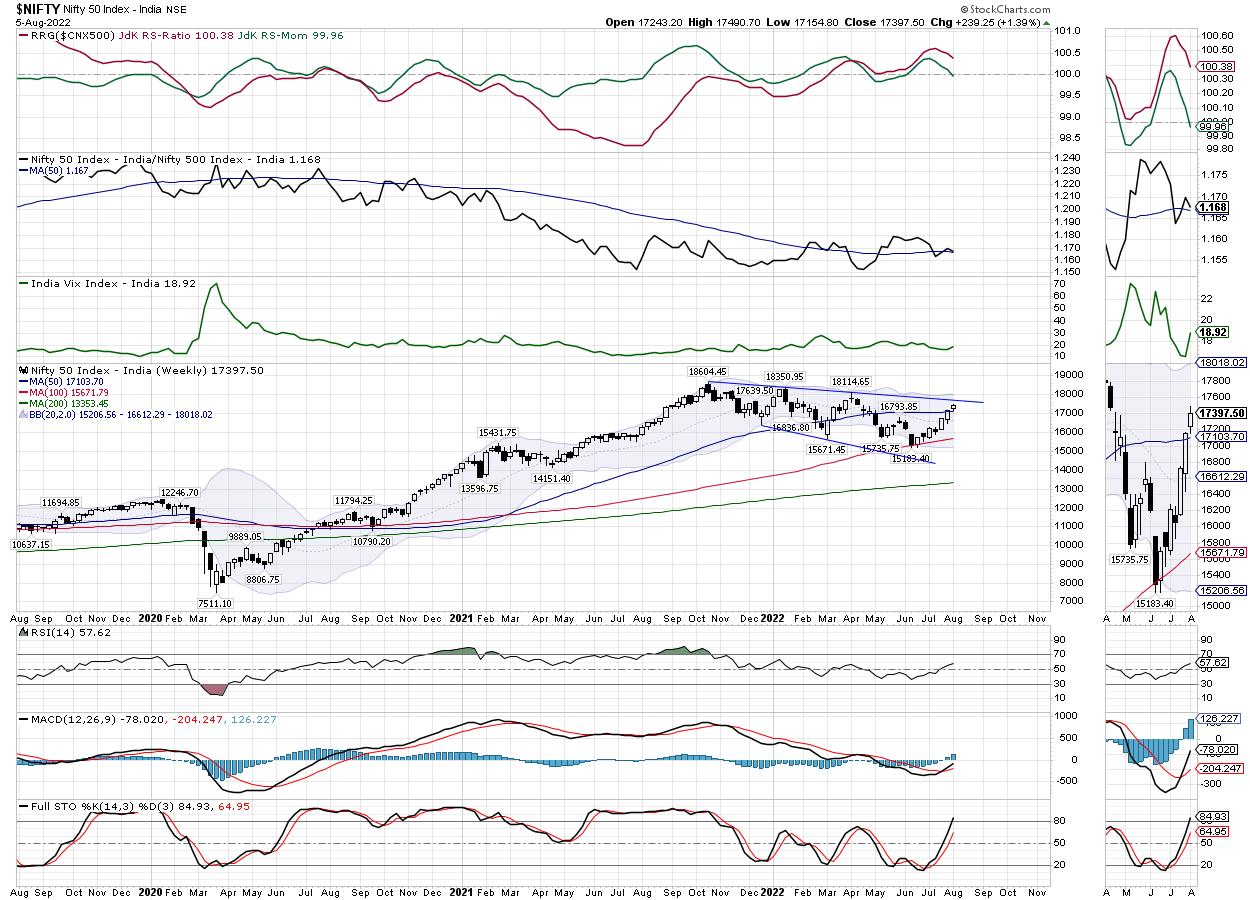
In the previous technical commentary and forecast, it was anticipated that this week may see some ranged consolidation. It was also expected that such consolidation may have ranged moves and some profit-taking bouts from the higher levels. However, the downsides were expected to stay limited. While dancing exactly to these tunes, the markets spent the week consolidating in a defined range with limited downsides. All sessions either saw the markets open lower and then recovering from lower levels, or the markets witnessed general profit-taking bout only to get bought at lower levels again. Given the consolidation behavior of the markets, the trading range also remained narrower; NIFTY oscillated just 335.90 points through the week. The headline index finally ended with a net gain of 239..25 points (+1.39%) on a weekly basis.
From a technical perspective, there are a couple of things that one needs to take note of. On one hand, the NIFTY opened above the 50-Week MA that stands at 17105 and stayed above that for the entire week. Now, the NIFTY is above all its key Moving Averages. On the other hand, on the lower time frame charts, the NIFTY has created a potential top at 17500 levels. This level is likely to act as resistance unless it is taken out comprehensively. Until this happens, we can expect profit-taking bouts from higher levels. In the same breath, one also needs to keep in mind that while the markets continue to remain prone to consolidation, they may stay range-bound with limited downsides. In the coming week, NIFTY’s price action against the levels of 17500 will be crucial to watch.
The volatility shot up; INDIAVIX surged 14.29% to 18.92 on a weekly note. The coming week is likely to see the levels of 17500 and 17625 acting as potential resistance points. The supports are likely to come at 17300 and 17180 levels.
The weekly RSI is 57.62; it has continued to mark a fresh 14-period high. However, RSI is neutral and does not show any divergence against the price. The weekly MACD is bullish and stays above its signal line. Apart from a white body that emerged on the Candles, no other significant formation was seen on the charts.
The coming week is a truncated week for the markets. Tuesday is a trading holiday on account of Moharram. It is very much likely that we see range-bound consolidation to continue with the 17500-17600 zone acting as a stiff resistance. Unless the levels of 17500-17600 are taken out comprehensively, it is strongly recommended to use all up moves to protect profits at higher levels. It is also unlikely that we will see any particular sector dominating the market landscape. The coming sessions are likely to stay highly stock specific in performance. A cautiously positive approach is advised for the week.
Sector Analysis for the coming week
In our look at Relative Rotation Graphs®, we compared various sectors against CNX500 (NIFTY 500 Index), which represents over 95% of the free float market cap of all the stocks listed.
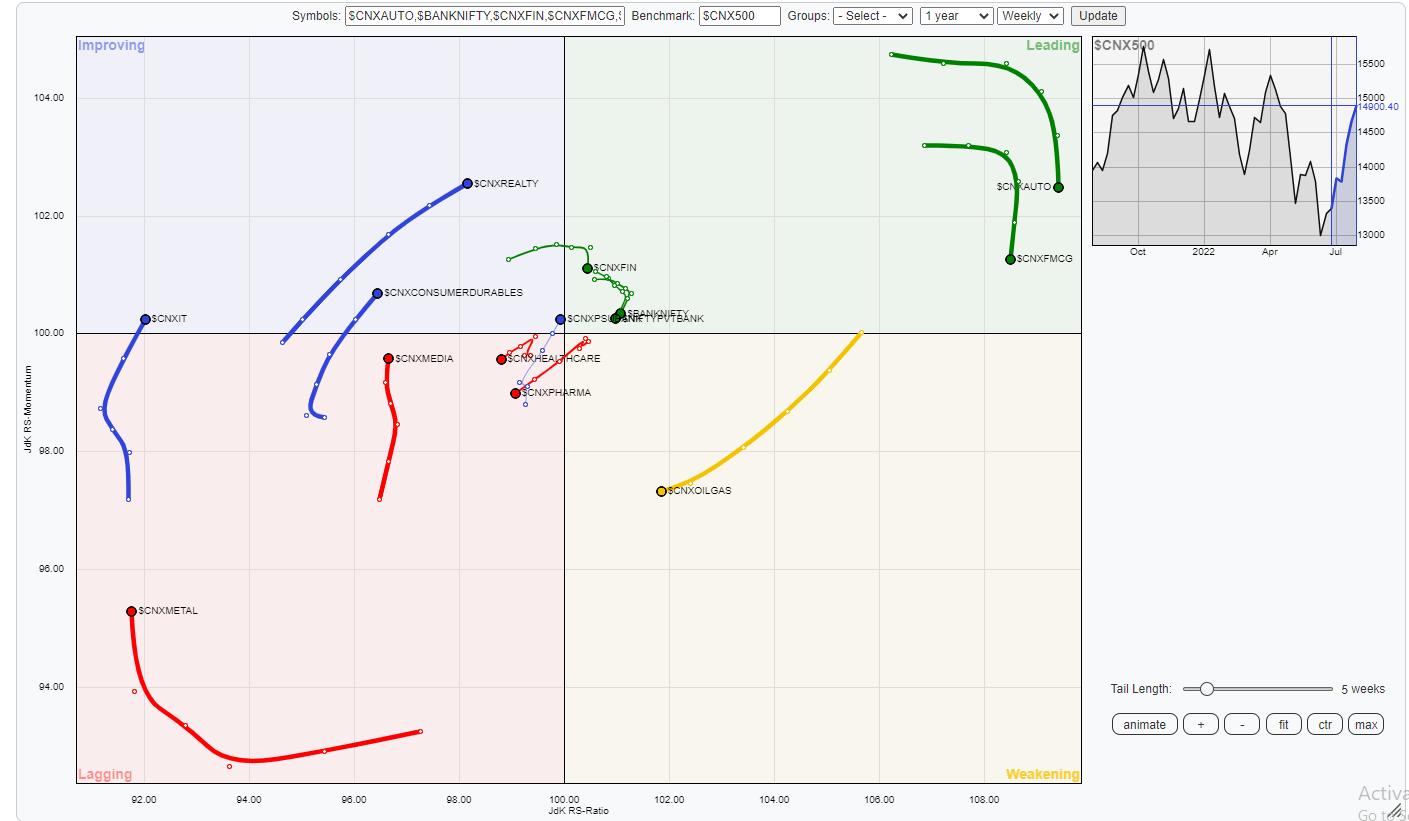
The analysis of Relative Rotation Graphs (RRG) shows that while NIFTY FMCG, Consumption, Auto, Financial Services, and Banknifty are inside the leading quadrant, they are all giving up on their relative momentum against the broader NIFTY500 Index. This shows that these groups may see themselves as taking a breather after strong moves seen in the recent past.
NIFTY Infrastructure and NIFTY Energy continue to stay in the weakening quadrant.
NIFTY PSE Index has rolled inside the lagging quadrant. It is likely to see relative underperformance against the broader markets. On the other hand, NIFTY Commodities, Media, and Metal Indexes are inside the lagging quadrant; however, they are seen improving on their relative momentum against the broader markets.
The NIFTY IT Index has rolled inside the improving quadrant. This indicates that the phase of relative underperformance might have ended for this sector. We will see this group performing better over the coming days. NIFTY Realty and Services indexes also stay in the improving quadrant.
Important Note: RRG™ charts show the relative strength and momentum for a group of stocks. In the above Chart, they show relative performance against NIFTY500 Index (Broader Markets) and should not be used directly as buy or sell signals.
Milan Vaishnav, CMT, MSTA
Consulting Technical Analyst