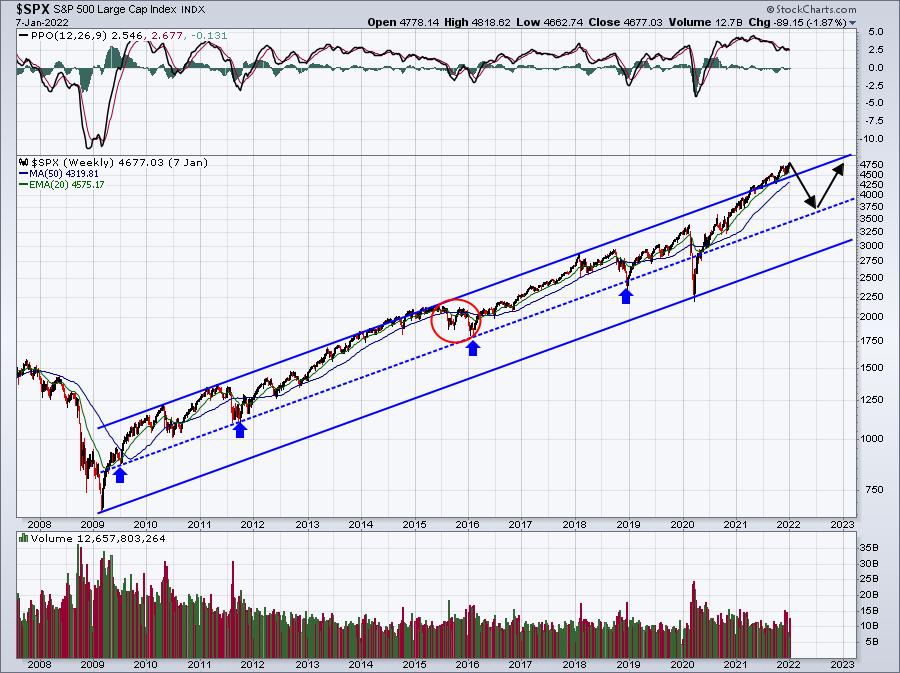
When I turned bearish at the end of 2021, I made it quite clear that I expected this stock market downturn to be fairly brief – at least in historical bearish terms. At our MarketVision 2022 event on Saturday, January 8th, I suggested that the S&P 500 would likely struggle for 3-6 months and I even provided a chart of the S&P 500 and how I expected we’d trade throughout the year, with a potential downside target of 3500-3800. Here was the chart I provided at that time:
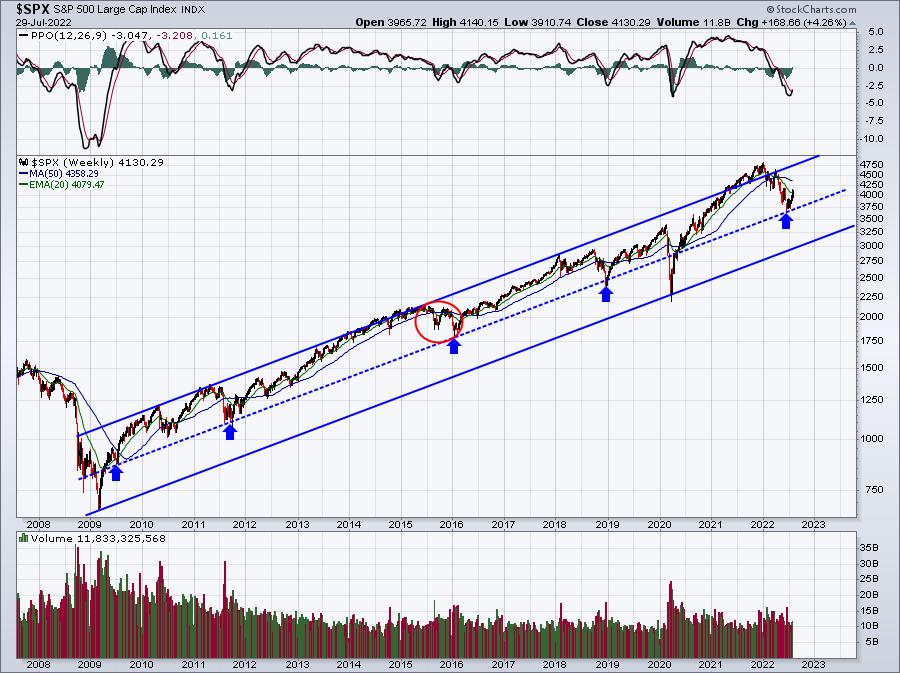
By connecting the bear market lows of 2009 and 2020 and then dragging that sloped line up to connect the periodic highs, you can see that the S&P 500 has traded in a channel (mostly) over the past 13 years. The midpoint of this channel has been tested several times and I was looking for yet another in the first half of 2022. The actual price action has been strikingly close to my outlook:
I’ve done a LOT of stock market research over the years. I’m always trying to better my understanding of how the stock market works and what we’re mostly likely to see. I’ve previously shown the typical stock market reactions AFTER a bear market concludes. If you haven’t seen it, here’s an Excel table that I produced as a refresher:
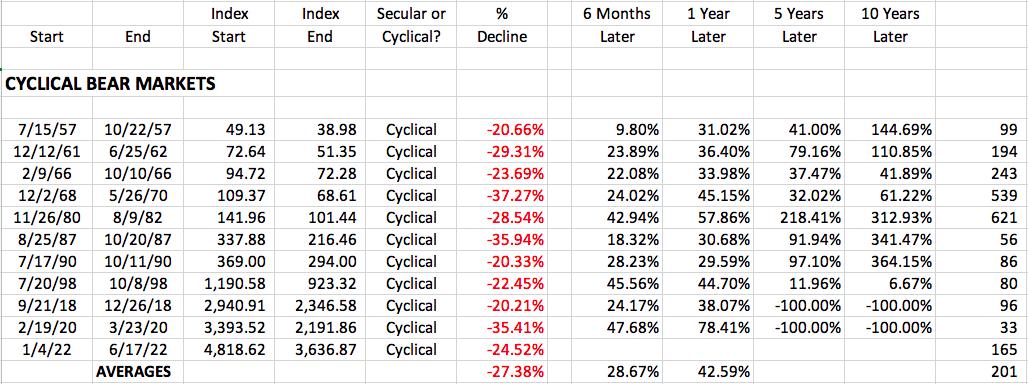
This is the ENTIRE list of cyclical bear markets since 1950. 2022 marks the 11th cyclical bear market since 1950. It lasted 165 days, a bit shy of the average cyclical bear market duration of 201 days. We saw a decline of 24.52% on the S&P 500, ranking it the 6th worst cyclical bear market (out of 11).
The average 1-year return after a cyclical bear market bottom is 42.59%. As of Friday’s high, the S&P 500 has rebounded 13.84%. If I had to guess right now as to how much we’ll rally in the 1-year period from June 17th, 2022, I’d guess 40%-50%, which would imply an S&P 500 range of 5091-5455 in mid-June 2023. I believe we’ll see it.
Resumption of Secular Bull Markets
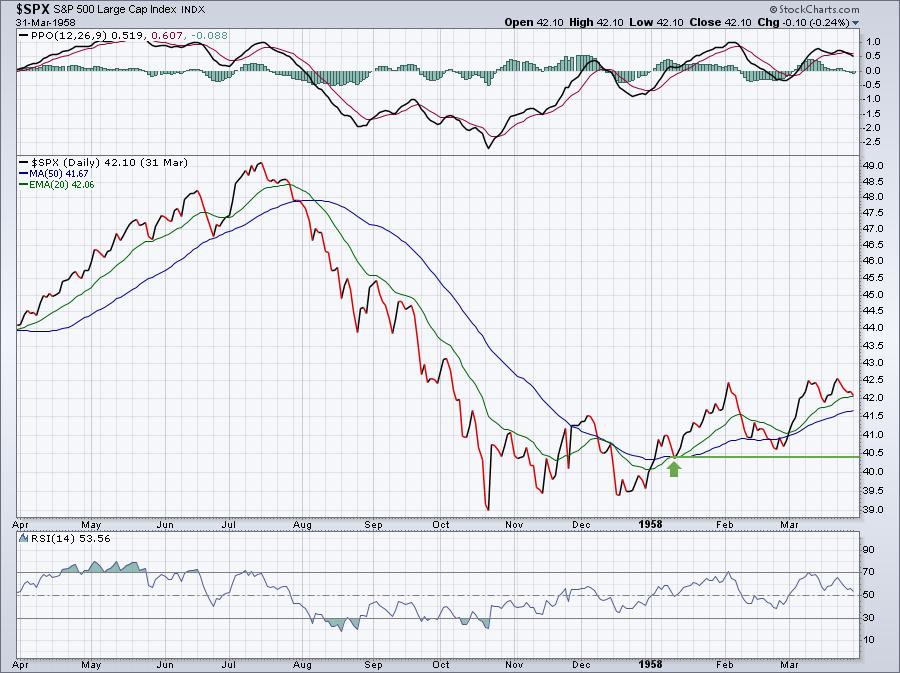
When cyclical bear markets end and secular bull markets resume, there’s historical precedence as to how we’ll trade. The several charts to follow provide you some history of how these cyclical bear markets ended and secular bull markets resumed:
1957:
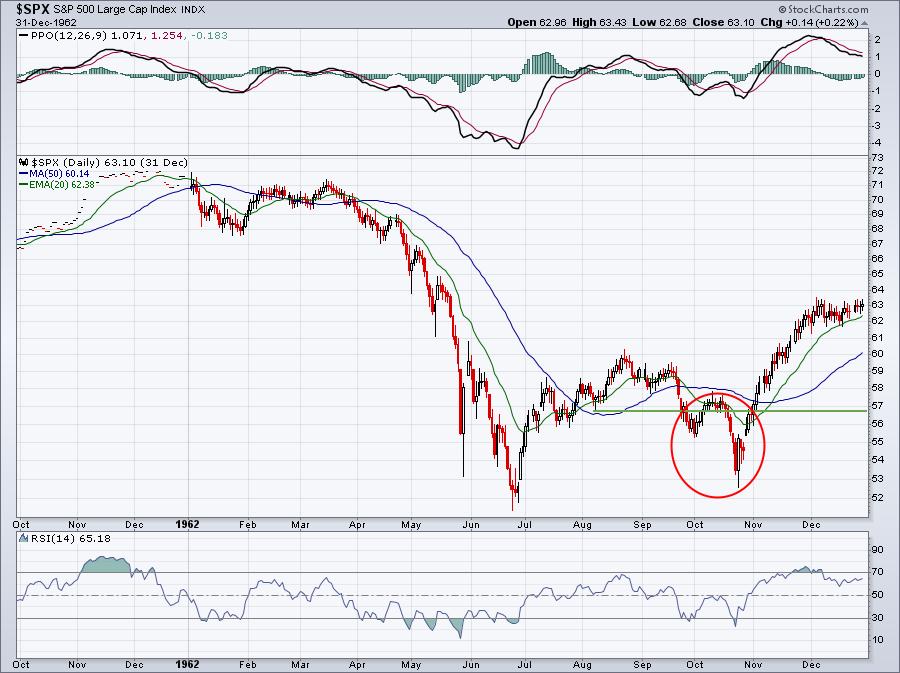
1961:
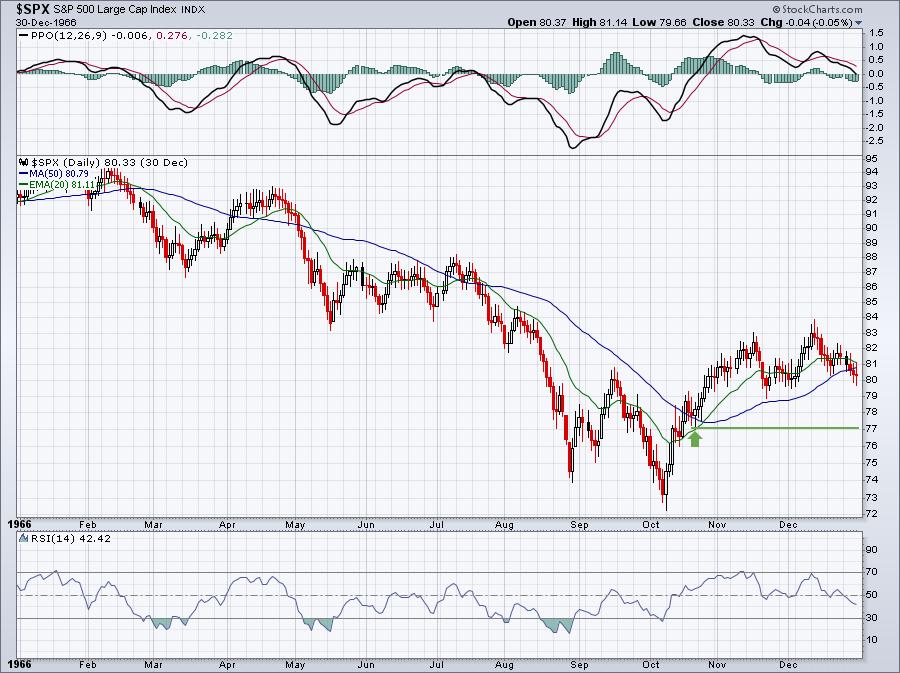
1966:
1968:
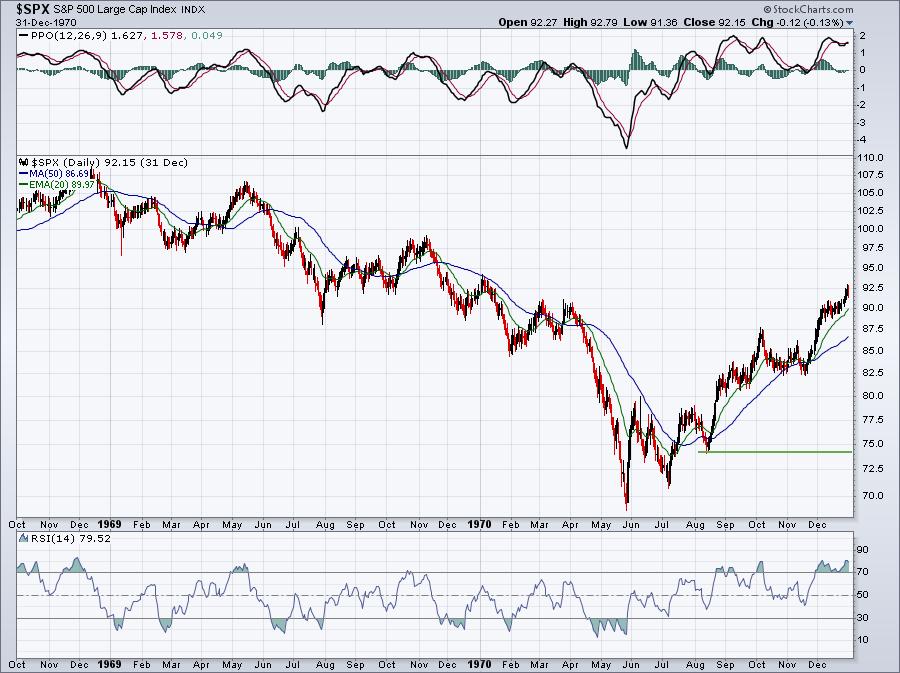
1980:
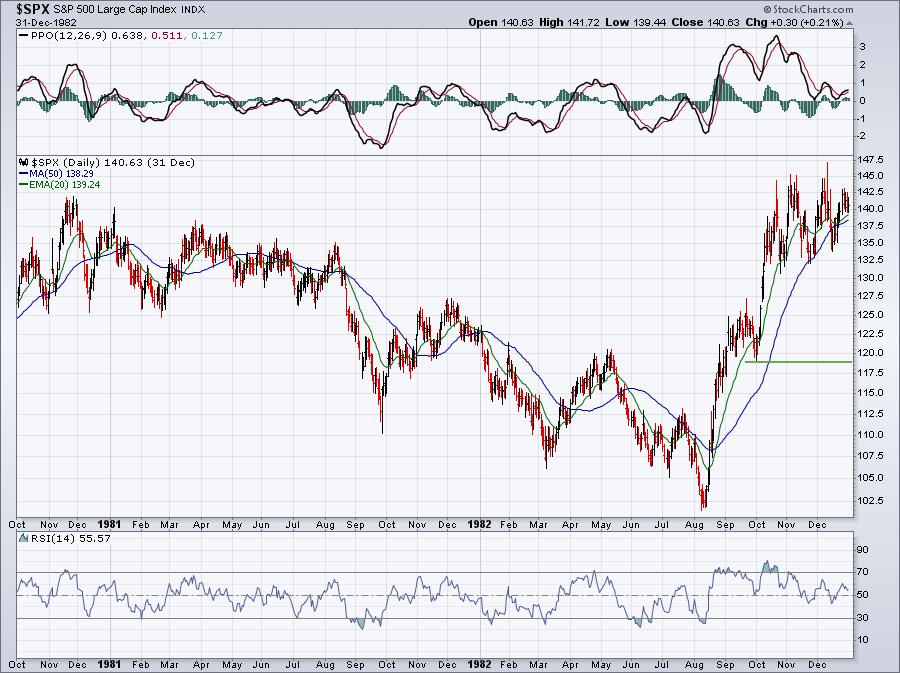
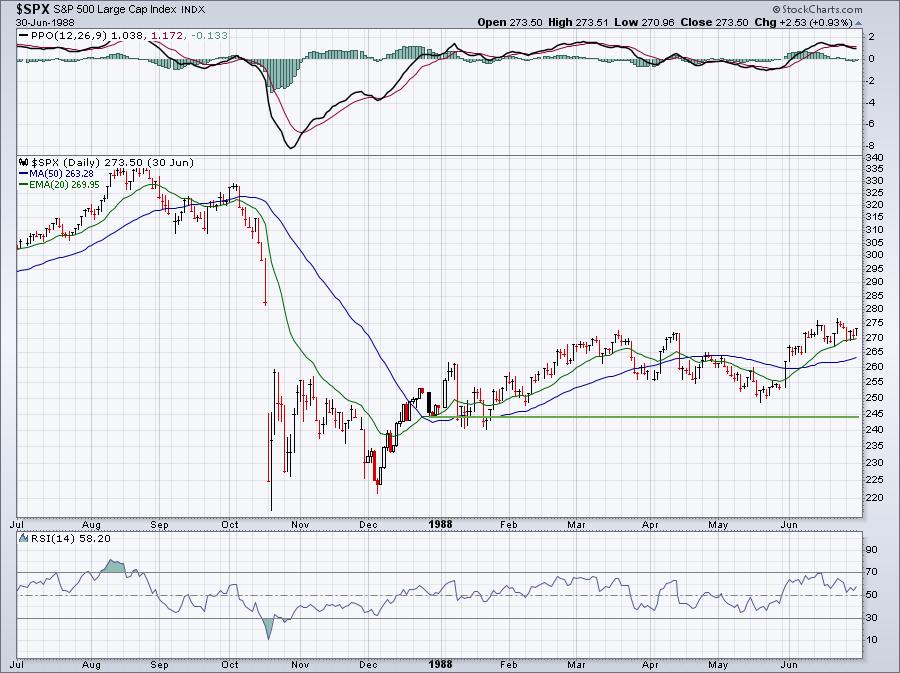
1987:
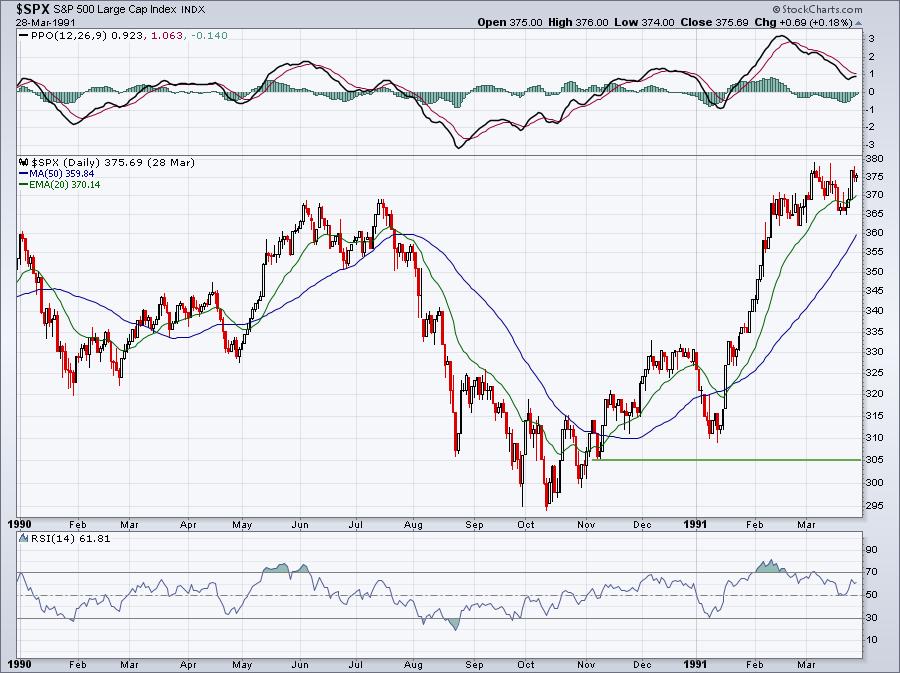
1990:
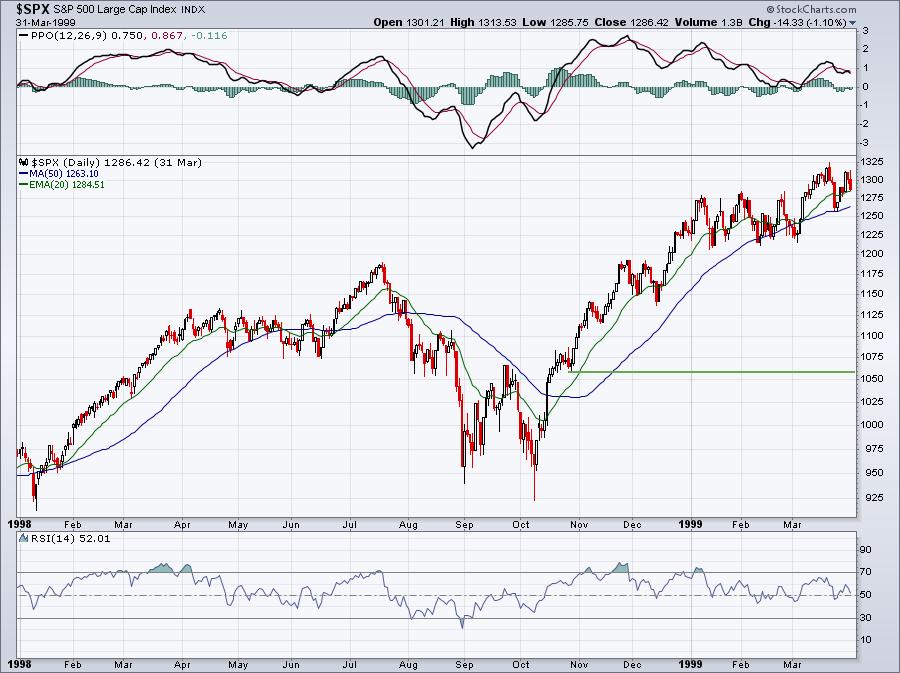
1998:
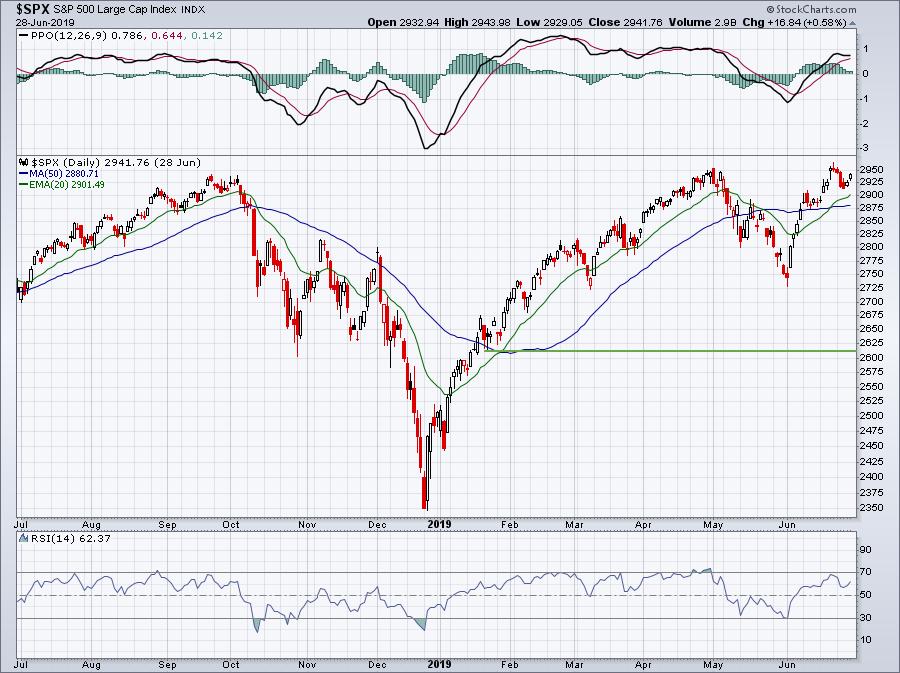
2018:
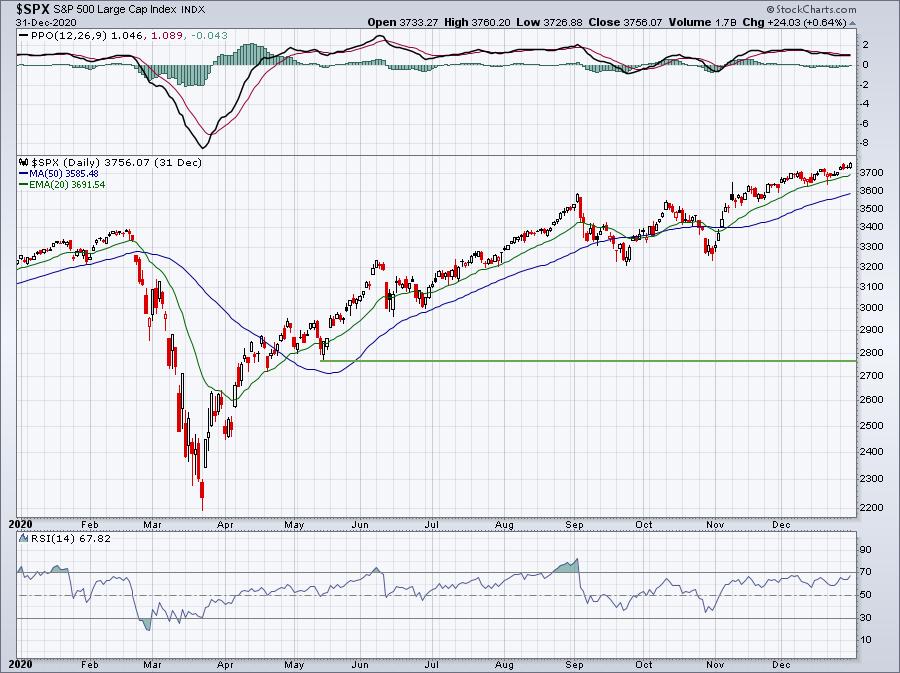
2020:
2022:
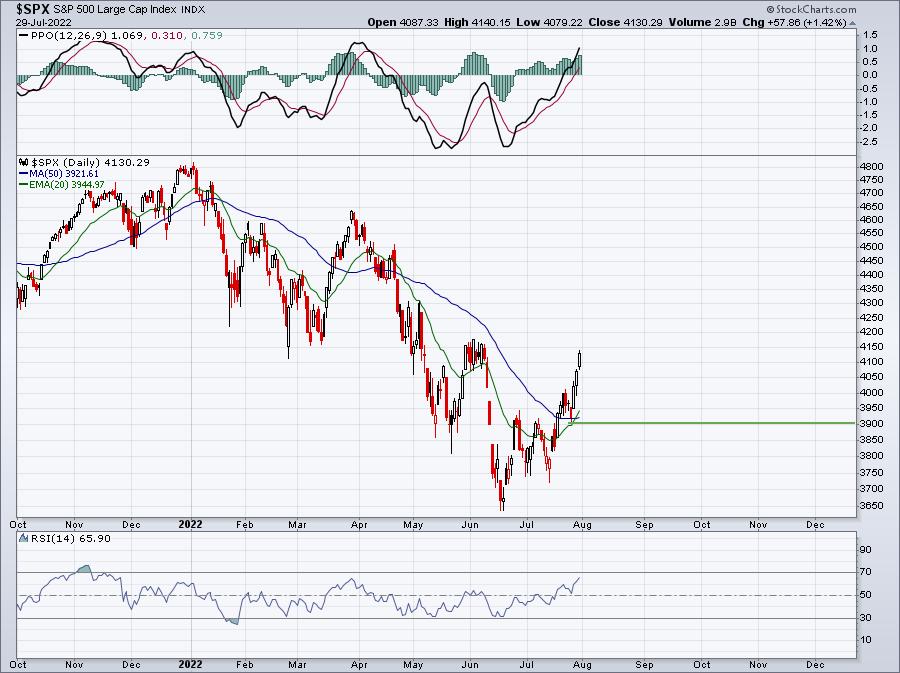
Once the S&P 500 broke back ABOVE its 50-day SMA, I drew a green price support line at the subsequent price low. The NEXT price high then confirmed that green price support line to be key support. The 1962 bear market was the only one that saw this price support level lost in any meaningful way after another breakout was made. 1987 did see intraday selling take the S&P 500 below that price support level, but that selling didn’t last long. You can see that, based on history, I’d be watching the 3900 support level on the S&P 500. I fully expect this will hold as price support. If it doesn’t, then the “resumption of secular bull market” thesis will need to be revisited.
For those of you convinced that this is a secular bear market (long-term), and not cyclical, there was a similar bullish signal in October 1973 that ultimately saw the S&P 500 drop another 40% over the next year. 2001 and 2008 also saw similar bullish setups only to fail and drop considerably further. So I am not, BY ANY MEANS, trying to guarantee any kind of market bottom. However, as I discussed in my June 16th Trading Places Live show, market signals told me that there was a very good chance we were bottoming. If I see it, I call it. I don’t lack conviction and I believe that serves me well, especially given the constant media scare tactics to generate clicks.
Objectivity is key in any stock market discussion and analysis. I believe we’re full speed ahead, but ANY close below 3900 suggests – at least from a historical perspective – that we consider the possibility that the bear market of 2022 has just begun and even accelerated selling could be in our future. But let’s remember that we have had 3 secular bear markets in my entire lifetime – and probably most of yours as well. Constantly investing with the notion that THIS time is THE worst bear market of our lifetime generally doesn’t work out well. It’s all about odds, probabilities, and how much risk you’re willing to take.
Again, I believe we’re heading higher – a LOT higher. I’m now looking at stocks that are showing bullish character changes on their charts and I am laser-focused on identifying and trading those ON THE LONG SIDE throughout the balance of 2022. On Monday morning, I’ll be writing about one such stock in my EB Digest newsletter. It’s a stock that I’m looking to own, when the reward to risk sets up appropriately. If you’re not already an EB Digest subscriber, please CLICK HERE to enter your name and email address for more information on this potential money maker. There’s no credit card required and you may unsubscribe at any time.
Happy trading!
Tom