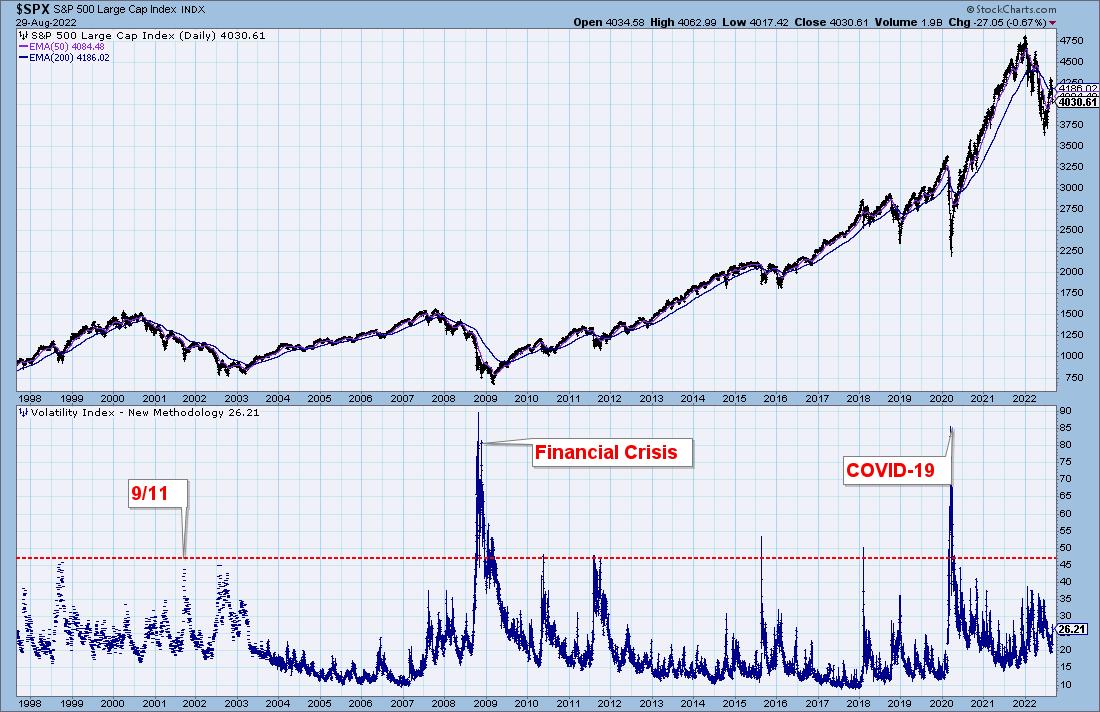
In yesterday’s DecisionPoint Trading Room (airs 3p ET), Carl took a close look at the VIX over the years. We discussed last week in our DecisionPoint Alert subscriber blog that sentiment simply wasn’t THAT bearish yet. This chart really reflects what we’re talking about.
The VIX is often considered a “fear gauge”, telling us how “fearful” market participants are. The higher the reading, the more fearful. We would draw your attention to the readings that occurred during the last 25 years. Notice that readings were exceedingly high at the end of the Financial Crisis and COVID-19 bear markets. Readings after 9/11 were much higher than now. There are VIX spikes during deep declines in 2010, 2011, 2015 and 2018. Those readings are still MUCH higher than what we have now. Readings today are insignificant in comparison.

Conclusion: We shouldn’t expect market pivot points based on sentiment until readings are “off the charts”.
Technical Analysis is a windsock, not a crystal ball. –Carl Swenlin
(c) Copyright 2022 DecisionPoint.com
Helpful DecisionPoint Links:
DecisionPoint Alert Chart List
DecisionPoint Golden Cross/Silver Cross Index Chart List
DecisionPoint Sector Chart List
Price Momentum Oscillator (PMO)
Swenlin Trading Oscillators (STO-B and STO-V)
DecisionPoint is not a registered investment advisor. Investment and trading decisions are solely your responsibility. DecisionPoint newsletters, blogs or website materials should NOT be interpreted as a recommendation or solicitation to buy or sell any security or to take any specific action.


