
[ad_1]
August is amongst the worst months of the year. It is the worst DJIA, S&P 500, Russell 1000 and Russell 2000 month over the last 34 years, 1988-2021 with average declines ranging from –0.3% by Russell 2000 to –0.8% by DJIA. For NASDAQ August ranks second worst over the same period with an average gain of 0.3%.
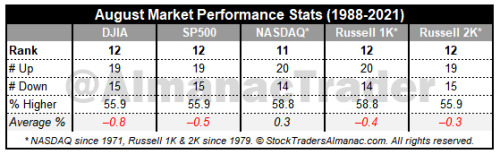
Contributing to this poor performance since 1988; the second shortest bear market in history (45 days) caused by turmoil in Russia, the Asian currency crisis and the Long-Term Capital Management hedge fund debacle ending August 31, 1998, with the DJIA shedding 6.4% that day. DJIA dropped 1344.22 points for the month, off 15.1%—which is the second worst monthly percentage DJIA loss since 1950. Saddam Hussein triggered a 10.0% slide in August 1990. The best DJIA gains occurred in 1982 (11.5%) and 1984 (9.8%) as bear markets ended. Sizeable losses in 2010, 2011, 2013 and 2015 of over 4% on DJIA have widened Augusts’ average decline.
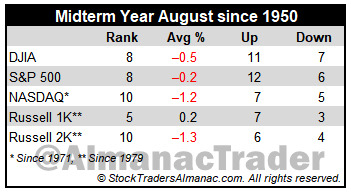
In midterm years since 1950, Augusts’ rankings improve slightly: #8 DJIA and S&P 500, #10 NASDAQ (since 1974), #5 Russell 1000 and #10 Russell 2000 (since 1982). Average losses range from –0.2% for S&P 500 to –1.3% for Russell 2000. Russell 1000 has advanced 0.2% on average in midterm Augusts. All five indexes having winning track records, but losses have frequently been substantially larger than gains. DJIA and NASDAQ suffered double-digit losses in 1974, 1990 and 1998.
[ad_2]
Image and article originally from jeffhirsch.tumblr.com. Read the original article here.