
[ad_1]
A recession has widely been defined by many economists as two consecutive quarters of decline in GDP. Whether or not you are a glass half-full or half-empty person, Q1 U.S. GDP was negative which does satisfy half of that definition. More recently the Federal Reserve Bank of Atlanta’s GDPNow model’s estimate for Q2 U.S GDP is also negative. In an effort to gain a better understanding of the market’s performance before, during and after recessions we have compiled the following table.
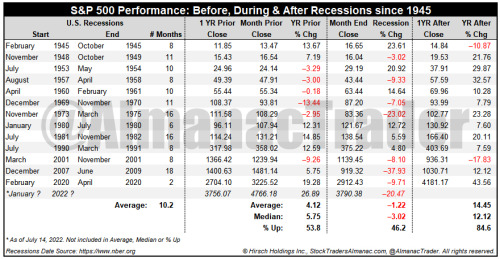
Dates for U.S recessions were sourced from the National Bureau of Economic Research (NBER). Since 1945, there have been 13 U.S. recessions. The most recent and shortest was the result of Covid-19 and began in February 2020 and ended two months later in April. The longest recession post WWII was caused by financial crisis in 2008-2009 and lasted 18 months. The average duration of a recession has been 10.2 months.
Historically, in the 1-year period prior to the start of the recession, S&P 500 has been positive 53.8% of the time with an average gain of 4.12%. In the table above, the year before the recession began is calculated using monthly closes. For example the 1-year prior to the Covid-19 recession was calculated using the close from January 2019 through the close of January 2020. During recessions S&P 500 historically advanced 46.2% of the time but with an average loss of 1.22%. Once the recession ended S&P 500 generally tended to soar 14.45% on average higher over the next year with gains occurring 84.6% of the time.
[ad_2]
Image and article originally from jeffhirsch.tumblr.com. Read the original article here.