
[ad_1]
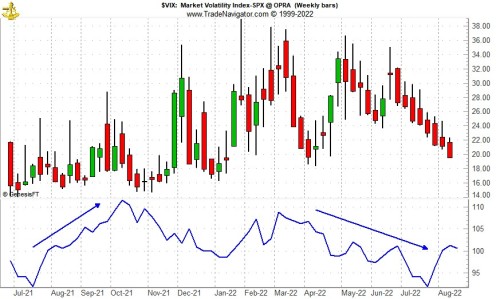
Historically speaking, the CBOE Volatility Index (VIX) tends to reach its seasonal low in late-July or early August and slowly begin climbing towards its seasonal high, usually in the month of October. This may be due to the fact that the two worst performing months of the year, August and September (by average performance) precede it. VIX’s seasonal pattern can be seen in the following chart.
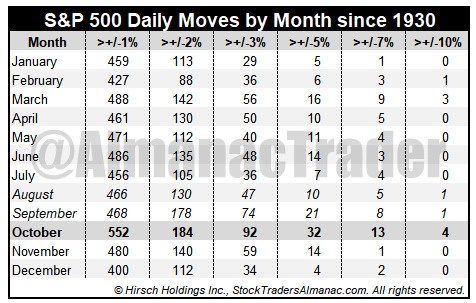
October’s volatility peak is also visible when closing daily percent changes are analyzed. October has hosted the most daily moves in excess of 1%, 2%, 3%, 5%, 7% and even 10% since 1930. Do not fret over the ten times S&P 500 has moved more than 10% in a single day. Six of the ten occurrences were way back in the 1930’s. Only four have occurred more recently and out of those, two were actually positive days (10/13/2008 +11.58% and 10/28/2008 +10.79%). Only three of the ten days with moves in excess of 10% were negative days: 3/18/1935 –10.06%, 10/19/1987 –20.47% and 3/16/2020 –11.98%.
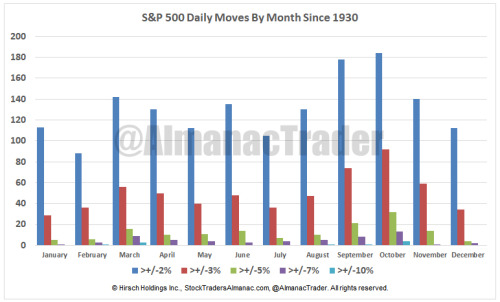
Putting all but the +/-1% moves table data into a bar chart adds a quick confirmation of October’s heightened volatility versus all other months. Volatility’s trend can also be observed as the frequency of sizable daily moves tends to decline from March through July then an increase in August lasting until October.
[ad_2]
Image and article originally from jeffhirsch.tumblr.com. Read the original article here.